
Macroeconomic news and monetary policy announcements from the central banks of several key economies led movements in implied volatility over the last month as traders looked to cover their exposure to further interest rate hikes and depeg dangers.
The market has priced and repriced both the level and skew of the volatility smile several times in response, reevaluating its relative positioning between BTC and ETH options.
Implied Vol
At-the-money
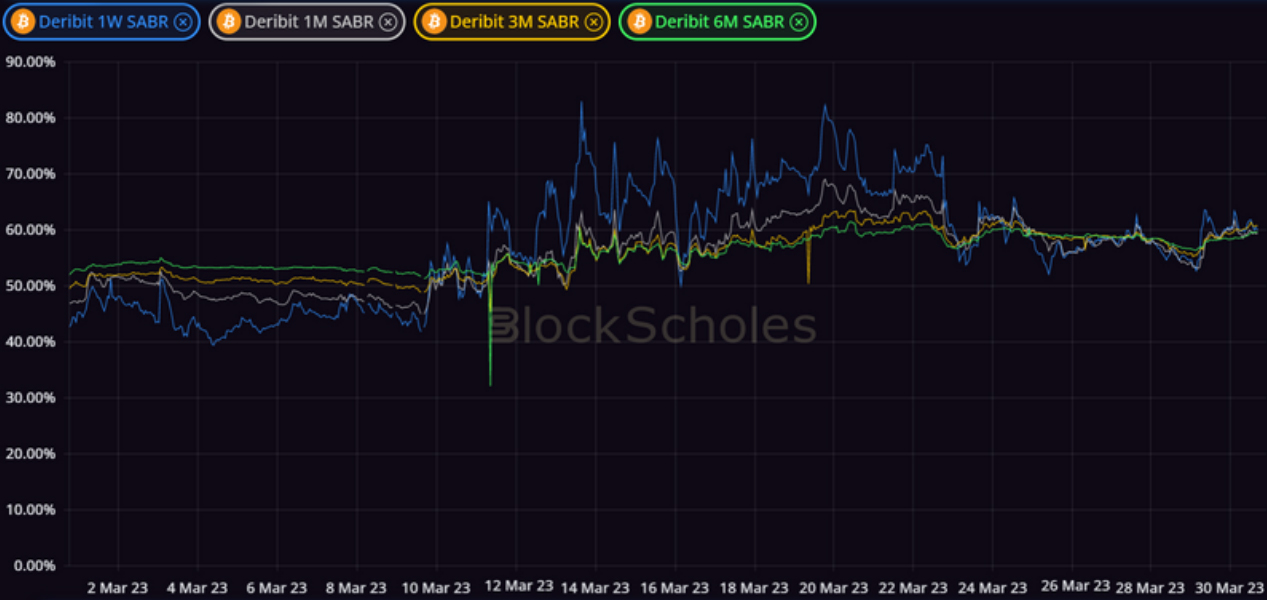
Figure 1 Hourly at-the-money implied volatility of BTC options at a 1W (blue), 1M (grey), 3M (yellow), 6M (green) 1st Mar 2023. Source: Block Scholes
At-the-money volatility was stable and near to the lower end of its historic range in late February and early March. The failure of several US banks, the depeg of USDC, and cascading concerns for the health of the financial system in response to rising interest rates caused vol expectations to pick up strongly by the second week. That volatility has continued following the strong spot price performance in the last two weeks, as well as the continuing fallout in banks not only in the US, but in Europe also.
These events have prompted several strong narratives to be considered and reconsidered by the market, including the possibility that Bitcoin is finally proved to be the inflation hedge that it has long been touted as. To many, the most recent bout of bank failures and bailouts is reminiscent of the Great Financial Crisis of 2008, a narrative that markets appear to have been keenly aware of as BTC tests a new upper barrier at $28K. Whilst, the circumstances between that period and today are drastically different, such actions play into one of Bitcoin’s (and crypto’s) original value propositions.
However, the FOMC meeting on the 22nd March confirmed broad market expectations of a 25 bps rate hike by the Fed saw short term volatility expectations fall sharply. This event signalled the end of the short-lived inversion of the term structure of volatility, which has continued to trend downwards at all tenors. This phenomenon has been common to many of the FOMC announcements over the last 12 months, as crypto-assets become sensitive to macroeconomic drivers and traders look to hedge uncertainty into an important announcement.
BTC and ETH Vol
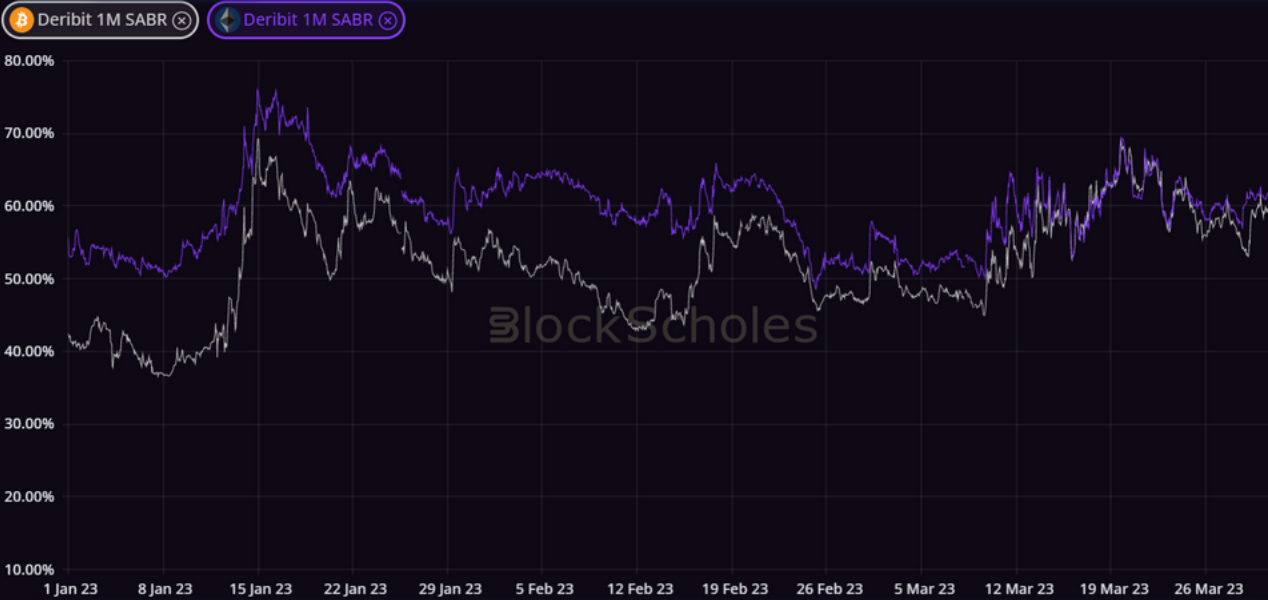
Figure 2 Hourly at-the-money implied volatility of BTC (grey) and ETH (purple) options at a 1M tenor from 1st Jan 2023. Source: Block Scholes
ETH’s derivatives market has broadly traced the same movements as BTC’s during the first few months of the year, rising sharply as both assets enjoyed a late January rally, and trading broadly sideways at a historically low level in late February. However, ETH options have long expressed a 10-15 vol point premium to BTC options at an equivalent strike and tenor, a phenomenon that we have recorded since January 2022.
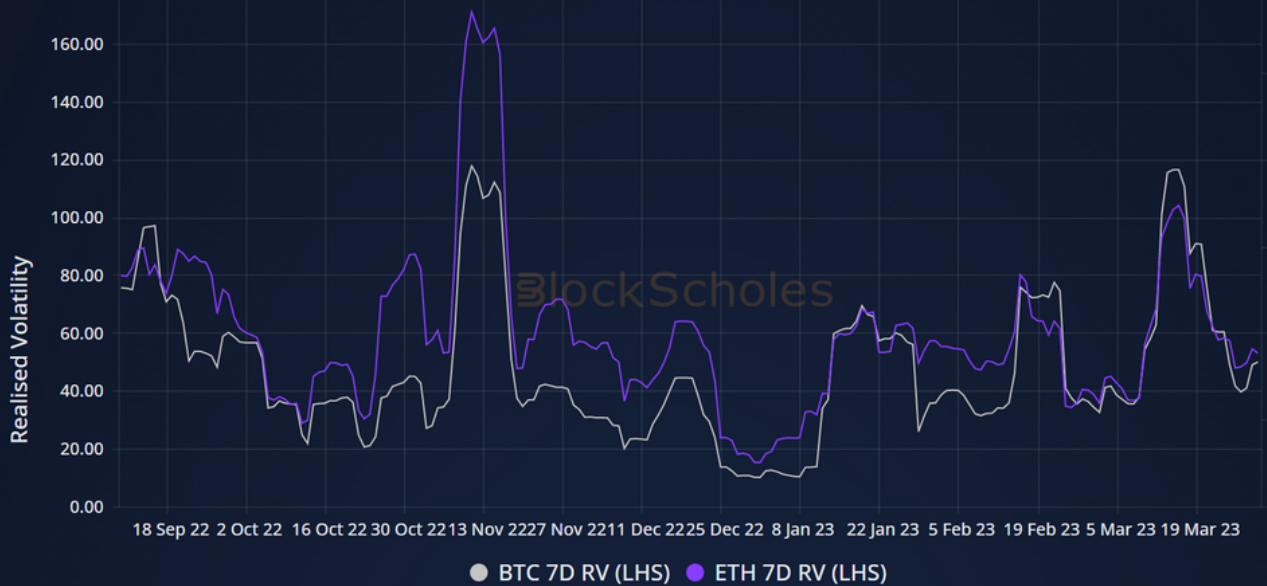
Figure 3 Hourly at-the-money realised volatility of BTC (grey) and ETH (purple) with a 7 day lookback 16th Sep 2023. Source: Block Scholes
Ether’s higher volatility expectations are likely due to the consistently higher realised volatility posted by ETH, a factor that became more pronounced during the several selloffs of 2022. The most recent bullish spot action has seen BTC outperform ETH’s spot price as its realised volatility dominated that of the latter token, which goes some way to explain the convergence in their implied volatility over the same time period.
The reasons for the higher realised volatility are less clear to us. Shorter term factors that explain the increase in the growth in the discrepancy between the realised vols of both assets over 2022 include the higher sensitivity to negative macroeconomic factors via stablecoins or other DeFi-specific drivers. Bitcoin’s network is less directly reliant on centralised and traditional finance, whereas Ethereum’s ecosystem is sustained by centralised stablecoins that are banked by cash and cash-equivalent deposits at centralised institutions. Those links to traditional financial institutions have acted as inlets for the troubles faced by several banks in the US.
Additionally, the SEC have recently brought action against Paxos, the issuer of the BUSD stablecoin, which has had implications for their view on the rest of the crypto ecosystem. Chairman Gary Gensler went so far as to state that “everything but Bitcoin is a security”, highlighting the difference in the way the market and regulators are thinking about the two assets.
Vol Smile Skew
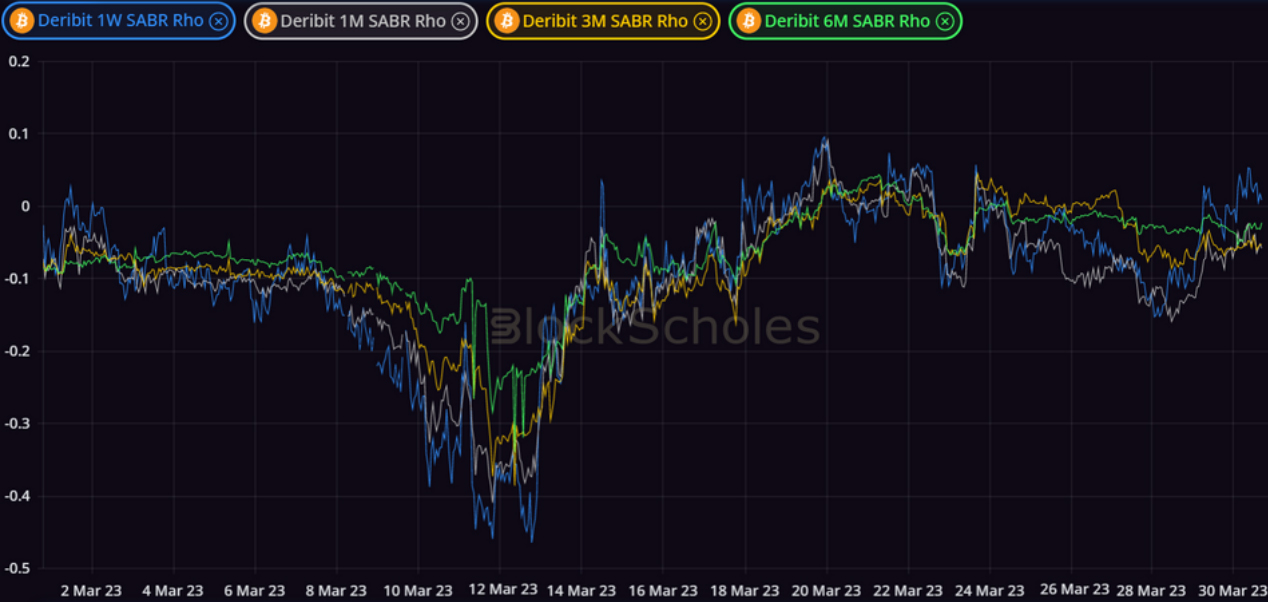
Figure 4 Hourly SABR calibrated skew parameter of BTC options at a 1W (blue), 1M (grey), 3M (yellow), 6M (green) 1st Mar 2023. Source: Block Scholes
The turnaround in market sentiment following the restoration of the USDC depeg was clearer nowhere more than in the skew of the volatility smile. The market began the month by expressing a roughly symmetric sentiment towards both up and downside protection at a 1 week tenor, with a negative tilt further out along the term structure than 1W.
News that 8% of USDC’s reserves were held by the troubled Silicon Valley Bank and fear of contagion to other crypto-assets, particularly to the Ethereum ecosystem, saw the vol smile skew heavily to the left as downside protection saw an increase in demand. Soon after, however, the announcement that issuers Circle would cover any shortfall in reserves saw the swift recovery of the stablecoins peg, as well as a reversal in the skew of BTC’s vol smile towards OTM puts.
That skew returned somewhat in the busy week of macroeconomic data releases that followed. Longer dated options reported a more neutral smile, until the most recent spot rally on the 29th March saw short term optionality express a preference for upside participation.
ETH Skew lags BTC’s
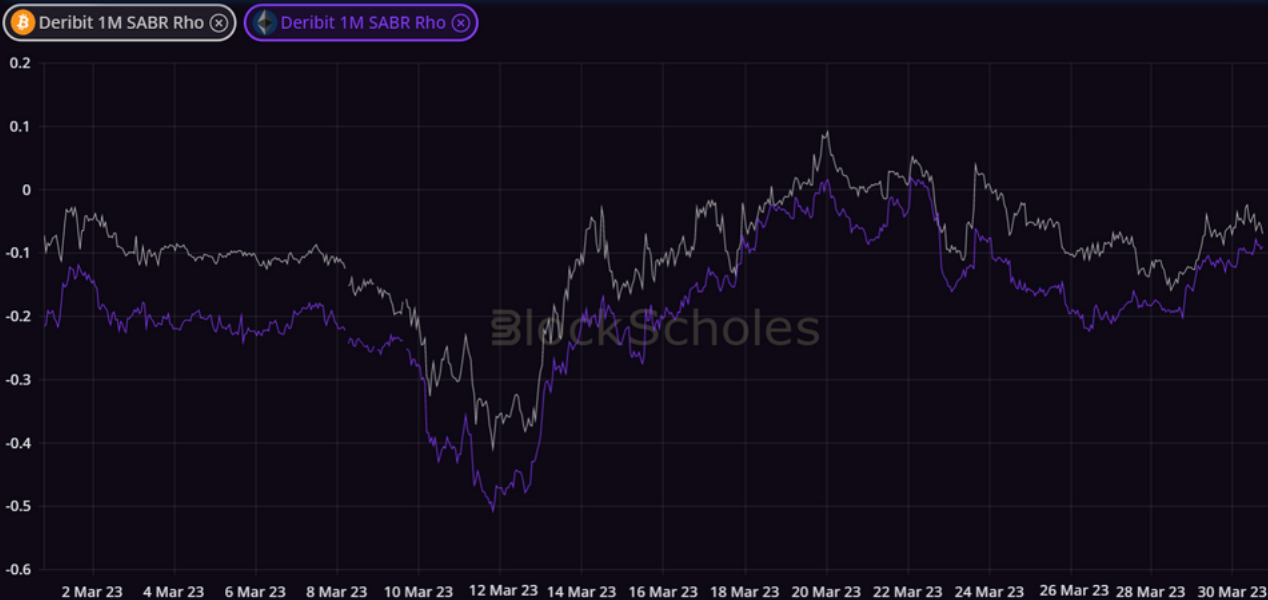
Figure 5 Hourly SABR calibrated skew parameter of BTC (grey) and ETH (purple) options at a 1M tenor from 1st Jan 2023. Source: Block Scholes
Despite ETH’s implied volatility moving closer to that of BTC’s over the past month and resolving the difference in implied volatility between the two assets’ options, ETH’s volatility smile remains skewed distinctly further towards OTM puts. This is present across the term structure, with the divergence between the asset’s options growing near to a 4M tenor.
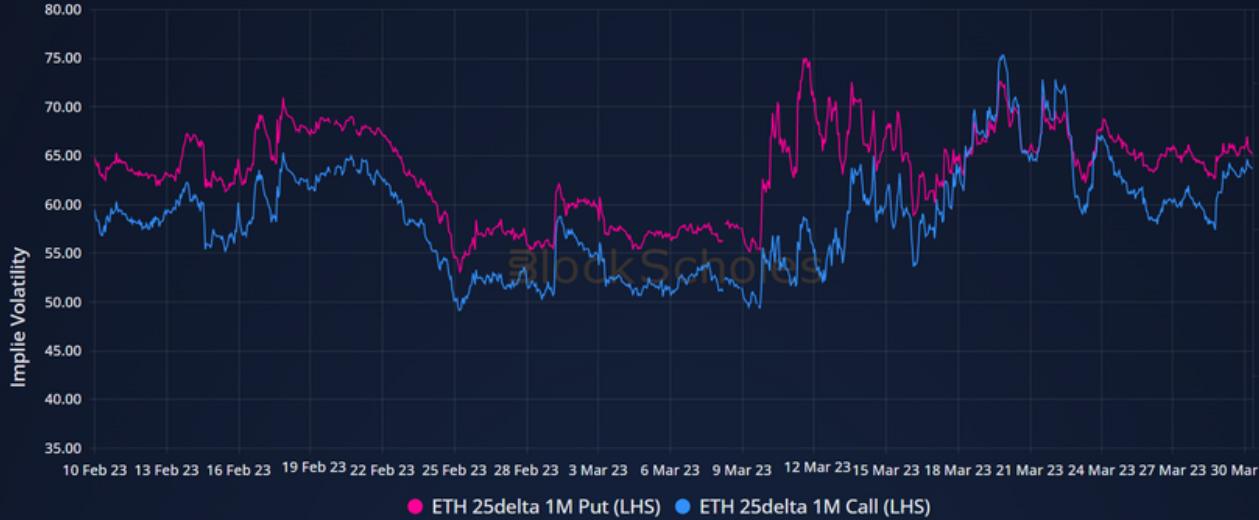
Figure 6 Hourly implied volatility of 25-delta BTC calls (blue) and puts (pink) at a 1 month tenor from 10th Feb 2023. Source: Block Scholes
We can look at the implied vol dynamics of ETH’s OTM calls and puts to get a better understanding of what is causing the more pessimistic skew value.The implied vol of 25 delta, 1 month puts has traded near to the elevated levels to which it spiked in response to the USDC depeg, oscillating around the 65% level. It was ETH’s OTM calls (shown in Figure 6 by 25 delta, 1 month expiry calls) that saw a decrease in implied volatility in the last week, causing a return of the skew towards OTM puts.
AUTHOR(S)
