

ETH spot prices outperformed BTC’s for the first month since July, in a drifting November rally that can largely be attributed to a weakening dollar.
The move higher came with a return to the higher-than-BTC volatility that ETH had moved with for much of its history, after briefly flipping the ratio in October. Volatility markets show signs of heavy positioning ahead of late January’s potential ETF application deadline, with tenors longer than 2 months pricing for a significant volatility risk premium above the recently delivered levels of both major crypto-assets.
ETH Out-Performance
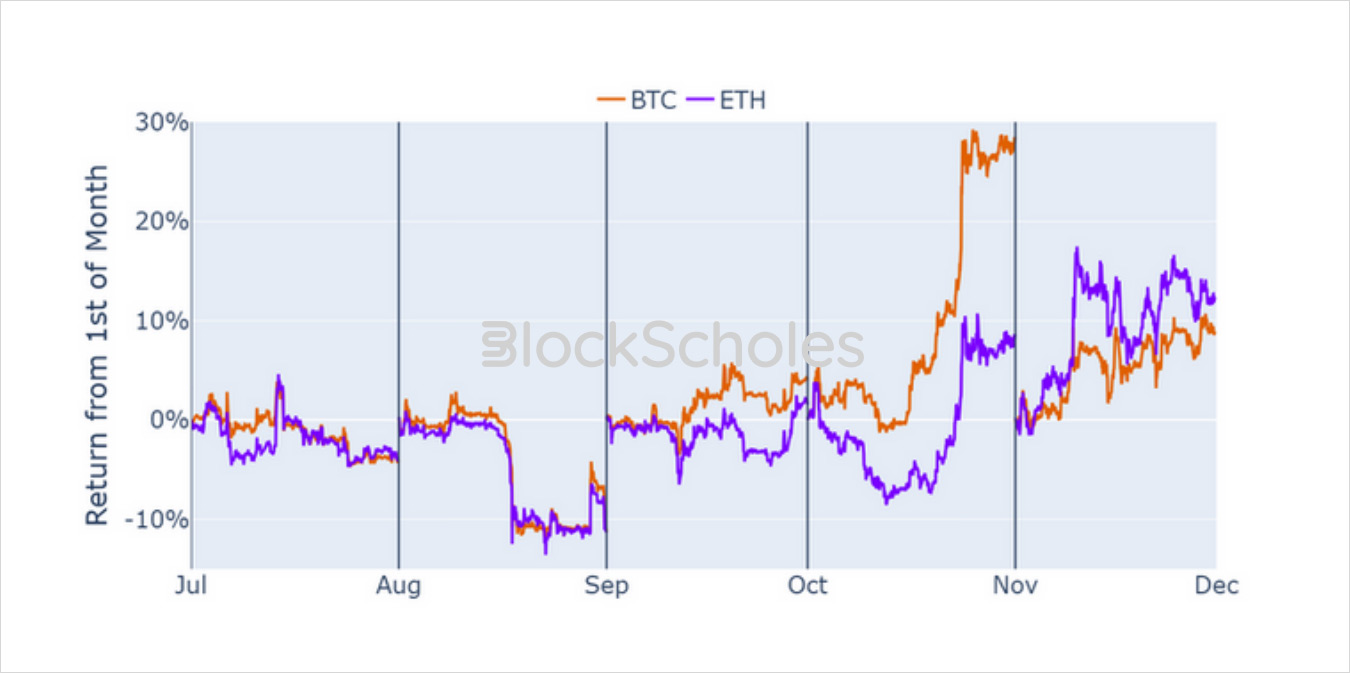
Figure 1 Hourly month-to-date spot price performance for BTC (orange) and ETH (purple) over the last 5 months. Source: Block Scholes
After a volatile mid-October swing, crypto-asset prices continued their upwar to trade at year-to-date highs in November. However, despite posting respectable returns of 8.8% and 12.6% respectively over the last month, much of BTC’s and ETH’s November performance can be attributed to a weaker dollar in anticipation of earlier interest rate cuts in the US compared to other Western economies. ETH recorded a month of out-performance over BTC for the first month since July this year – when both majors reported losses just larger than 4%.
Despite failing to repeat October’s parabolic swing, the volatility delivered by both assets continued its trend to trade with the highest values that we have seen since May, a significant recovery from the all- time low levels that we recorded in mid-August. ETH outperformed here too, as the upward move returned realised volatility levels above 50% – bucking the downward trend of Ethereum volatility relative to Bitcoins that has played out over the last year.
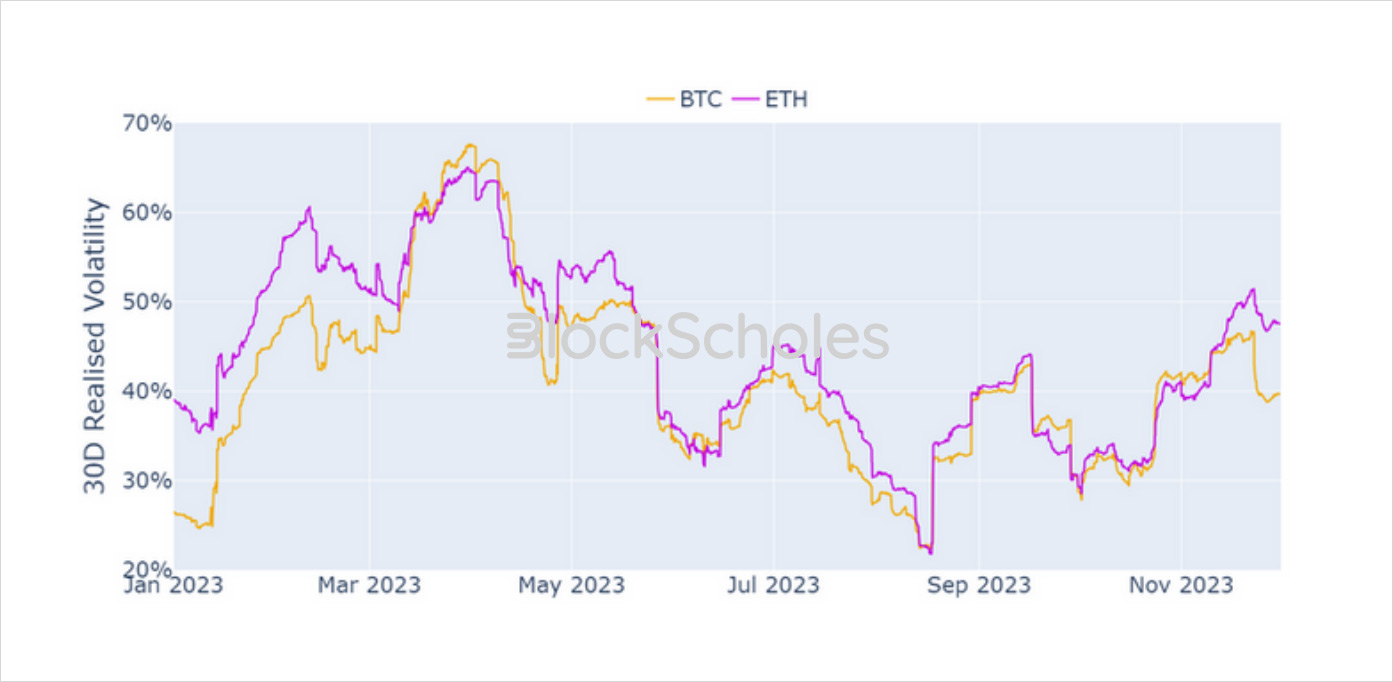
Figure 2 Daily 30-day realised volatility of BTC (orange) and ETH (purple) since 1st January 2023. Source: Block Scholes
However, while ETH has traded with higher volatility than BTC once again, the ratio between the two has returned only to levels around which it has oscillated for most of 2023. This reversal is not yet strong enough for us to be confident in a return to the market structure that we had previously come to expect, but does indicate that the effects of speculative bets around the application of a spot ETF are not limited to BTC. This is echoed by the implied volatilities for both assets across the term structure, which forecast similar volatility levels for both assets.
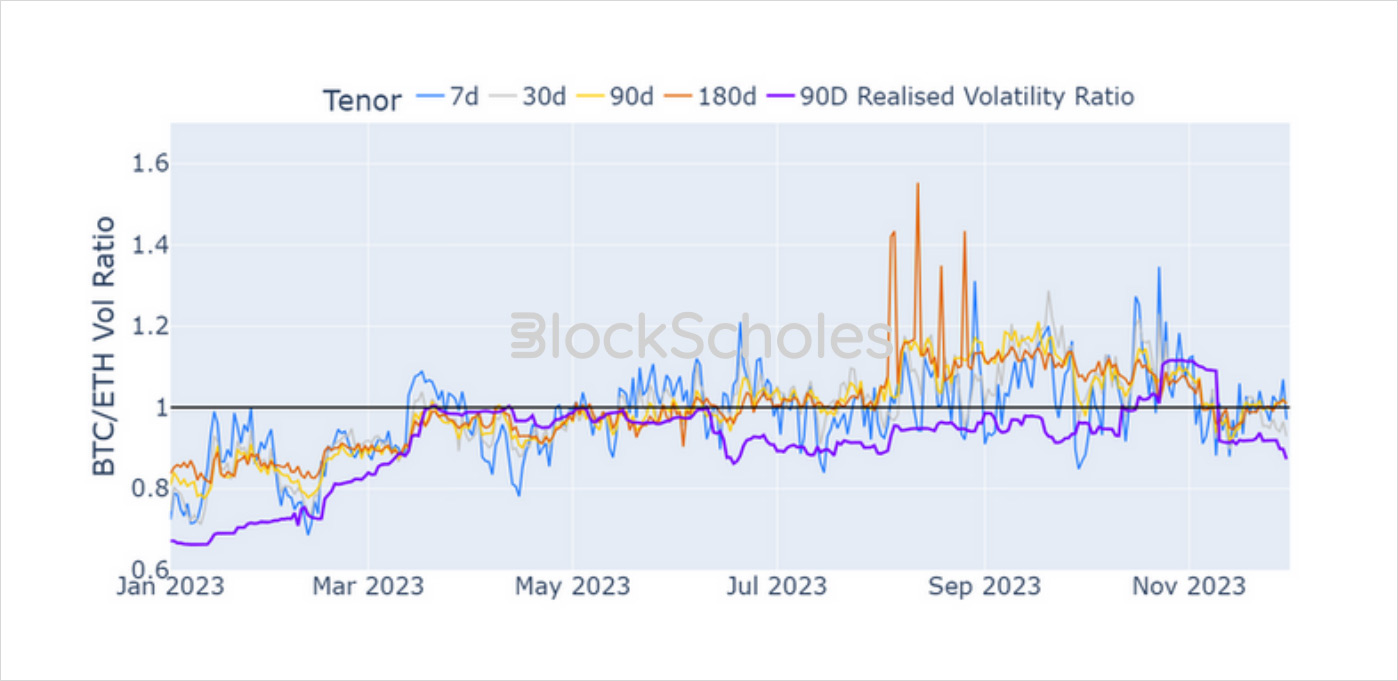
Figure 3 Daily ratio of BTC to ETH ATM volatility at 7-day (blue), 30-day (grey), 90-day (yellow), and 180-day (orange) tenors, with the ratio of BTC’s to ETH’s 90-day realised volatility since Jul 2023 (purple). Source: Block Scholes
The ETF Date Looms
Despite realised volatility continuing its recovery from all-time lows, BTC’s volatility markets are not pricing for its current trend to continue in the short term. Forward-looking volatility expectations remain close to the level that has been recently delivered (estimated at 40% over the last 30 days) for much of the end of the year. This is even in spite of the final FOMC meeting of 2023, which highlights the certainty of that interest rate decision more so than a departure of crypto-assets from the effects of monetary policy.
Volatility expectations do not rise until tenors of 2 months or later. At these tenors, Bitcoin markets are assigning a far larger risk premium to volatility above the level of recently delivered volatility. While we would expect to see longer tenors pricing for a higher risk premium, it is strange to see such a stark difference between adjacent tenors. This suggests that the market is pricing in an event risk around the end of January, close to the tentative deadline dates for several spot Bitcoin applications.
Figure 4 Ratio of BTC implied volatility at several key tenors to the level of volatility delivered over the previous 30 days. Source: Block Scholes
Note that we see a similar divergence in the term structure of ETH’s at-the-money implied volatility, but with a lower risk premium assigned to each tenor. As such, the risk premium demanded for ETH volatility is historically high, but trending downward and below BTC’s.
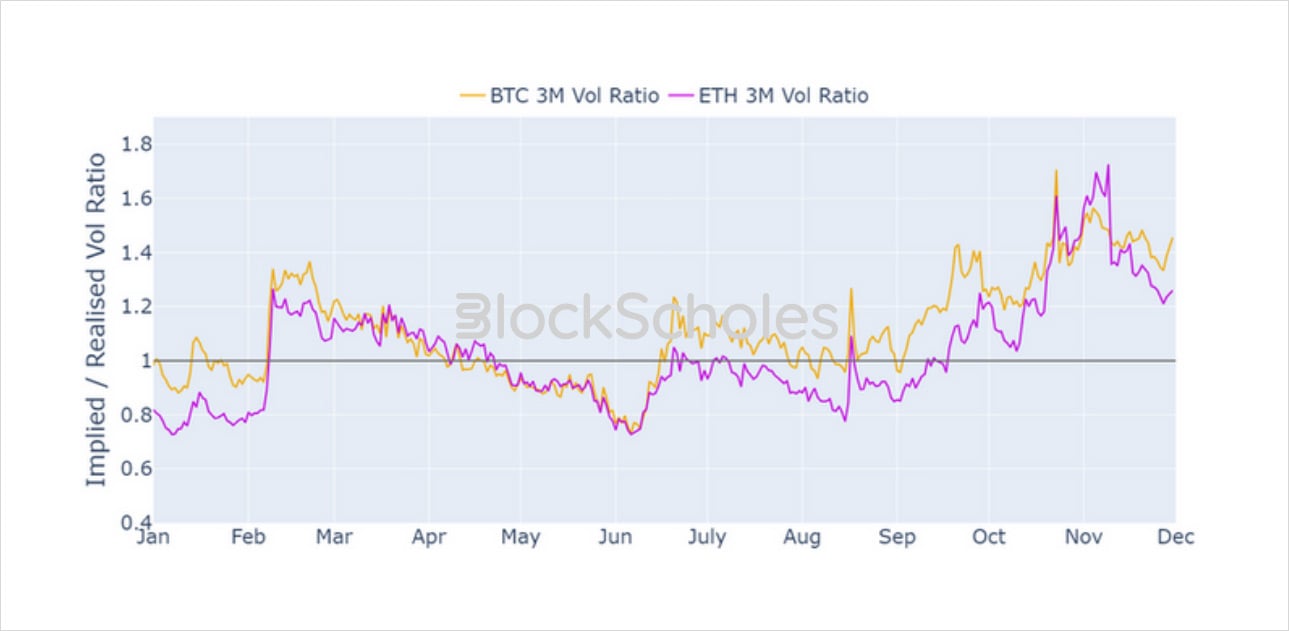
Figure 5 Ratio of 90-day tenor implied volatility to the volatility delivered by BTC (orange) and ETH (purple) since Jan 2023. Source: Block Scholes
November has largely seen a consolidation of bets in both spot and derivatives markets ahead of the new year, as the yields implied by futures prices have drifted sideways. Short-term volatility has fallen to price for levels barely above the volatility that has been recently delivered, as traders prefer to assign a significant risk premium to vols at expiries in January or later. This date marks the provisional deadline for the approval or rejection of several outstanding spot Bitcoin ETF applications, and sharp skews of volatility smiles at those expiries towards out-the-money calls clearly indicate the demand for upside participation.
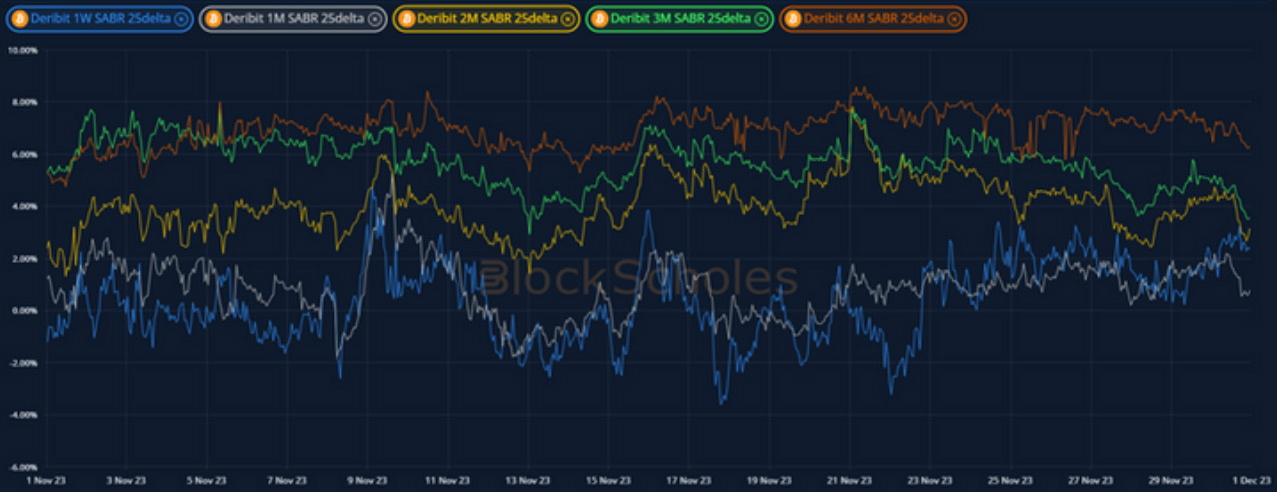
Figure 6 BTC 25-delta risk reversal at several key tenors over November 2023. Source: Block Scholes
It is interesting that we observe the same in ETH’s options markets, but we should not be too readily drawn by a transitory lapse in spot return correlation so soon. The uncertainty wrought by a looming ETF application deadline applies to all crypto, and not least for what it implies about wider institutional adoption of the entire asset class. As with previous bitcoin-led bull markets, we should expect to see a similar rotation of capital to ether and other alt-coins.
AUTHOR(S)
Trading with a competitive edge. Providing robust quantitative modelling and pricing engines across crypto derivatives and risk metrics.