
Last week traded range bound once again before a large spike (this time on Sunday) pushed us to test $24,000 with spot BTC wicking up to $23,966 (Coinbase ref) prior to a swift reversal during the Asian trading open. All eyes are on the FOMC meeting this week with a noticeable elevation in IV across the 2/3 expiry that includes FOMC.
Dealer gamma has recently been a popular trend to take a look at as it seemingly held more weight in the less liquid crypto markets than that of equities. In recent conditions it may make more sense to trade the gamma exposure of underlying option portfolios through delta hedging than to cross wide spreads in vol terms to close out open short option positions. Combined with poor liquidity conditions into the weekend and after-hours, and relatively poor spot liquidity conditions, a few million dollars of dealer spot hedging might just end up playing a pivotal role in potential liquidations. I’ve been keeping a note of how positioning and expiries have been playing out.
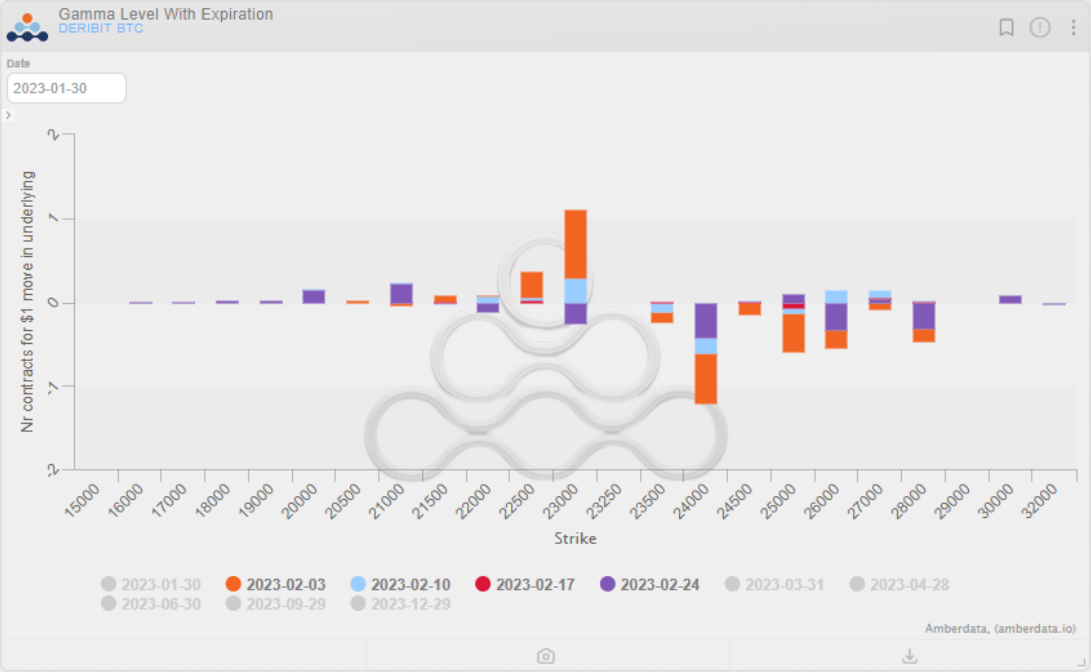
Figure 1. Dealer Gamma Exposure (BTC)
Term Structure for BTC and ETH
Looking at the term-structure of now compared to Friday at 00:00 UTC, there’s noticeable backwardation in the post-CPI expiry onward with longer dated expiries showing a slight shift downward in IV terms with pre-March expiries trading slightly above Friday’s levels and post-March expiries trading slightly below.
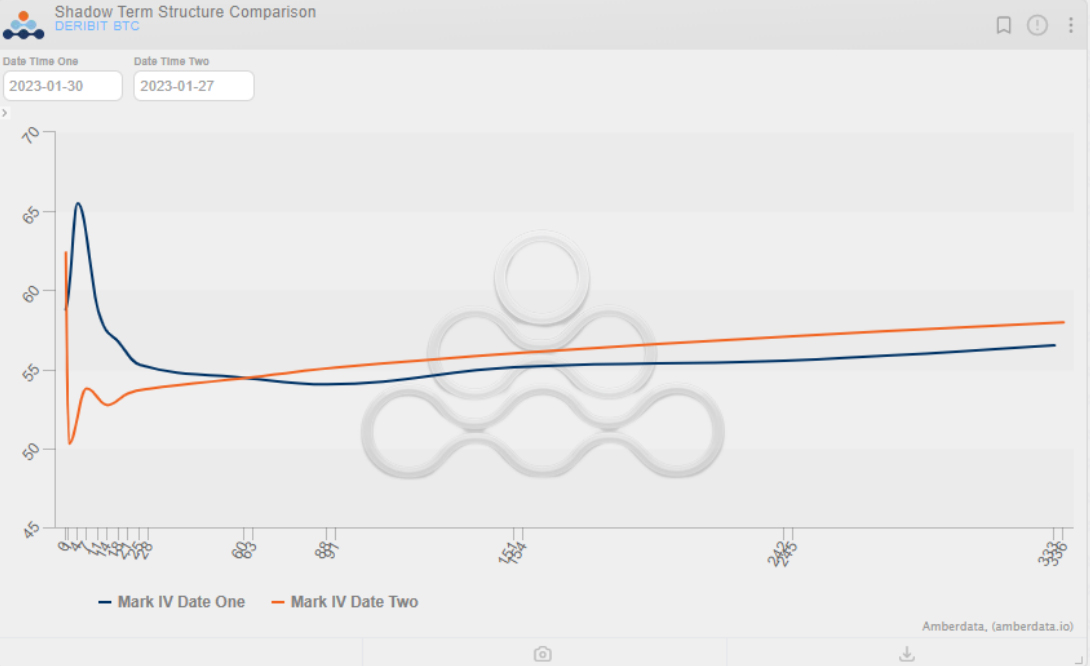
Figure 2. BTC Term-Structure (Friday 00:00 UTC vs Now)
A new chart by Amberdata Derivatives quantifies this level of backwardation or contango into an easy-to-read metric I’ll be referring to occasionally. The graph below shows “Term Structure Richness” with a level of 1.00 being perfectly flat while measures below/above represent Contango/Backwardation respectively.
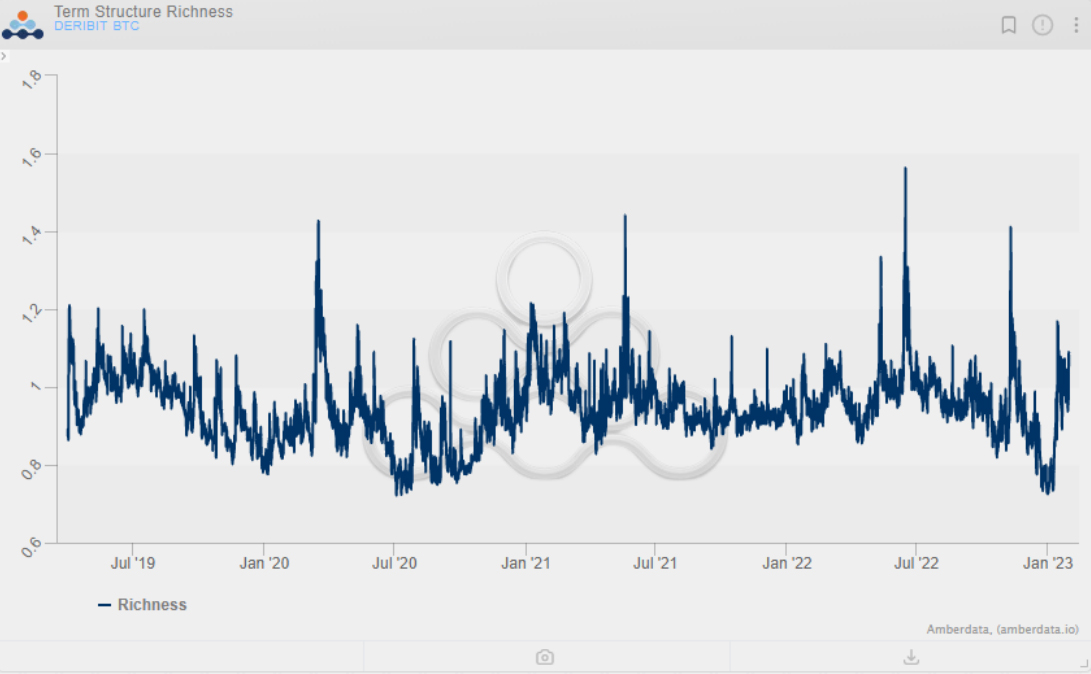
Figure 3. BTC Term-Structure Richness
In ETH, the term-structure curve looks a bit more dislocated and has two crossovers compared to Friday 00:00 UTC. These kinks and crossovers in the term-structure can most likely be attributed to longer term positioning for post-Shanghai ETH upgrade as well as recent flows in the options markets covered later.
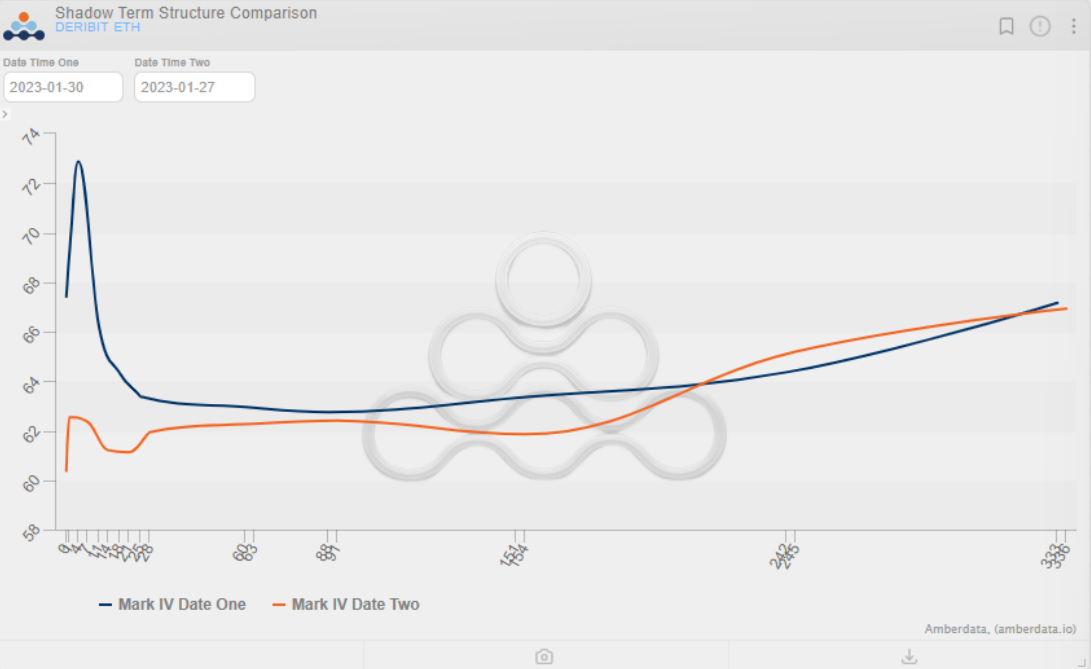
Figure 4. ETH Term-Structure (Friday 00:00 UTC to Now)
Skews and for BTC and ETH
Compared to Friday 00:00 UTC, short-dated skew as indicated by the 25D risk reversal shows call skew slightly elevated, whereas call skew post-FOMC has slightly softened. Performance in the wings compared to Friday’s open has been slightly better as demand for wingy options has increased heading into FOMC as indicated by the 25D Flies.
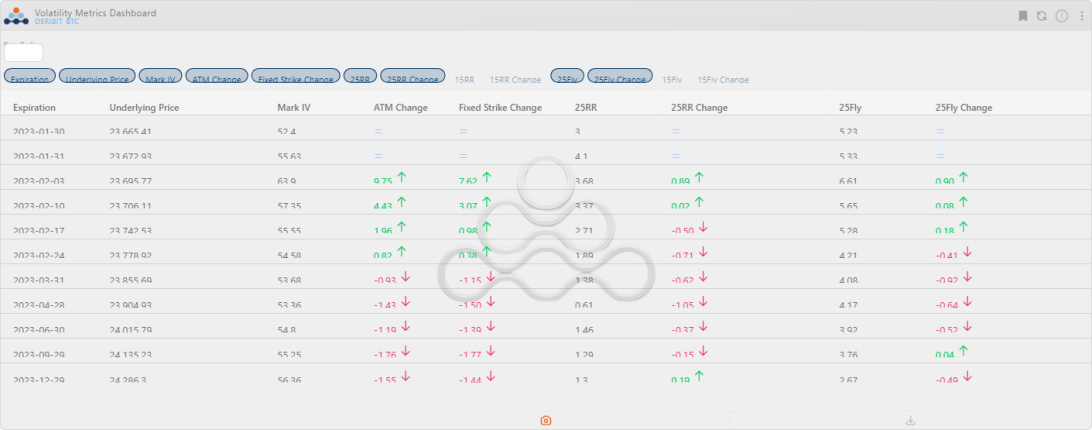
Figure 5. Volatility Metrics Dashboard (Friday 00:00 UTC vs Now)
While skel relatively favors calls across all expiries for BTC, ETH call skew has softened with puts now trading at a slight premium in the near-term expiries. This dislocation in ETH vs BTC skew still shows a “BTC dominant” rally leading the charge with upside demand and bullish sentiment reflected more in the positive near-dated skew compared to ETH.
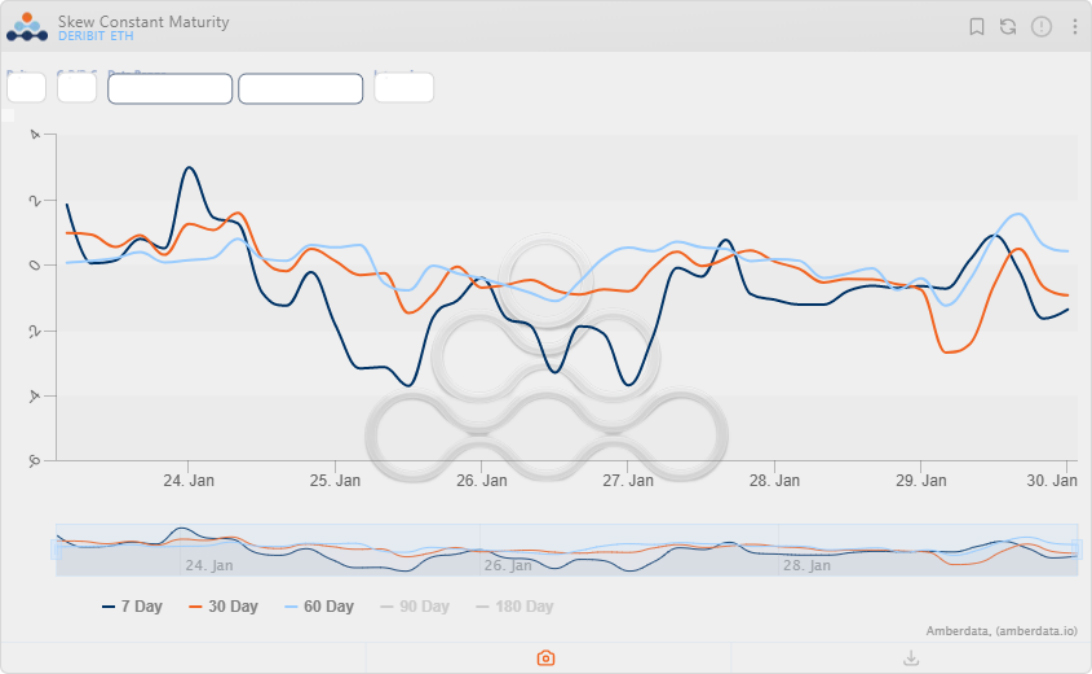
Figure 6. 25D Skew Chart (ETH)
Noticeable Flows Throughout the Week
Call buying and call spreads for Feb 3 rd went out in size for BTC over the weekend with several interesting blocks of short straddles coming out earlier in the week.
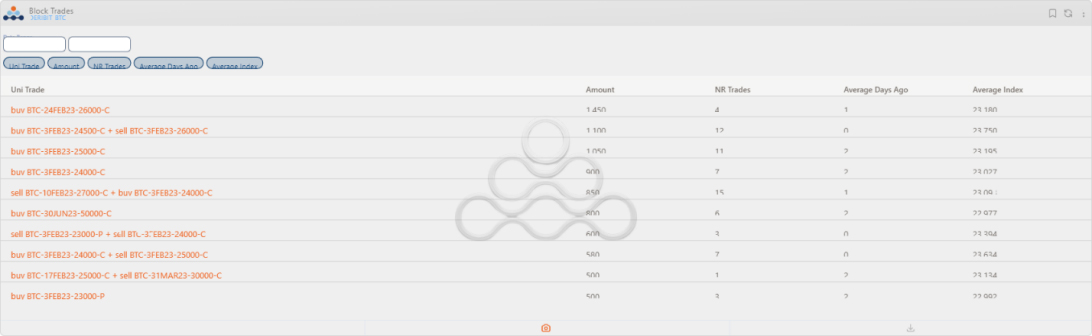
Longer-dated outright buys or perhaps rolls in the 29SEP23 3K calls and 28APR23 1.8K calls may have had some impact on the weirdly shaped term-structure exhibited in ETH as of 03:00 UTC Monday. For more detailed insight into block trades this week, take a look at Paradigm’s recent tweet.
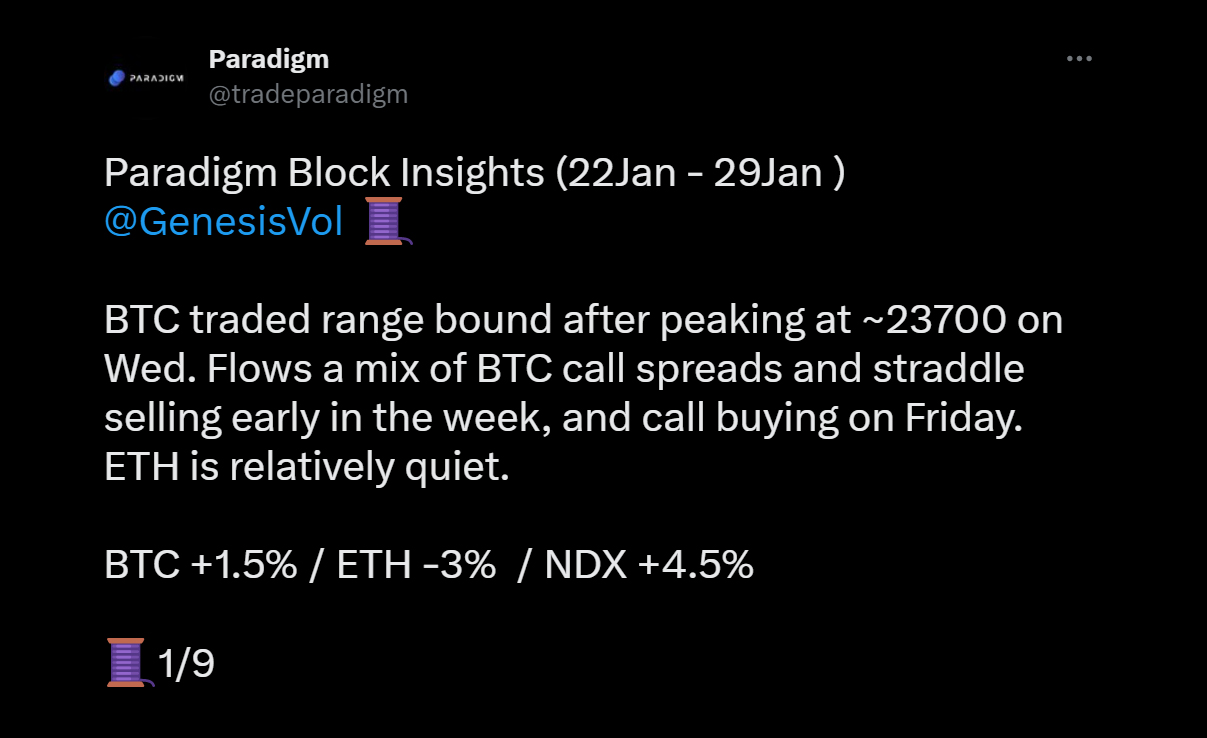
Twitter Thread by Paradigm
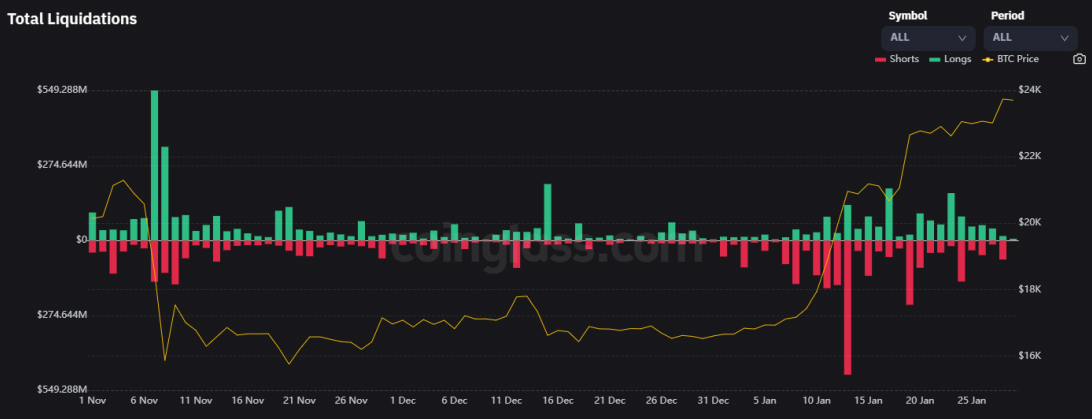
Liquidations
Liquidations saw a slight tick-up over the weekend compared to the later end of last week as we tested $24,000, but nothing too out of the ordinary which will surely be noticed upon a strong breakout above current levels. Liquidations are still relatively BTC dominant with $29M liquidated on 1/28 in BTC and $21M liquidated in ETH. (Coinglass ref).
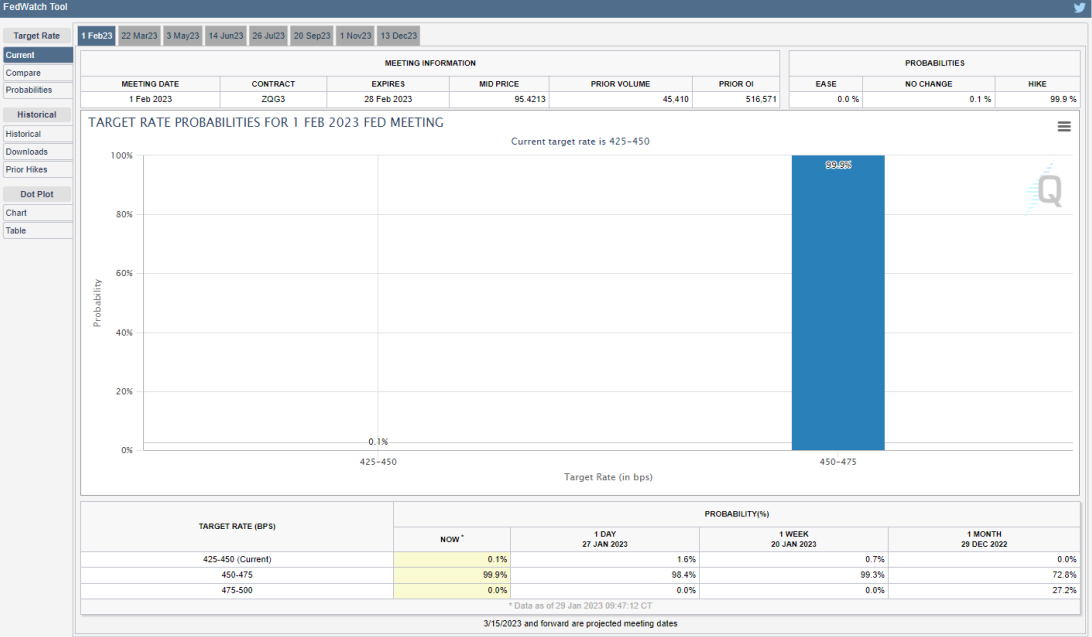
A Look Ahead
This upcoming week contains what I believe to be one of the potentially most impactful short-term price-action driving events. Some might argue that after the recent CPI print in January, markets have been positioning for quite some time for a dovish outcome of the meeting. Which may lead some to believe the event has been “priced in”. Regarding those “some” the current probabilities for a 25 bp rate hike are at 99.9%, with a 0.1% chance of no hike at all as of CME’s Fedwatch tool. This week will decide both long-term market positioning and the reaction of short-term traders.
AUTHOR(S)
Chris Newhouse is an OTC Trader at GSR, a crypto native market-maker that specializes in providing liquidity across spot and derivatives markets.