

Last week was one of the more recently exciting periods to trade since FTX. While Monday started with a significant breakout above the previous range-bound trading environment, the excitement showed no signs of cessation – continuing into the night BEFORE CPI, the day of CPI, and even into after-hours trading on Friday. While Monday saw BTC opening around $17,125, as of Sunday night EST, we’re trading around 23% higher as market participants wake up into the new year and start putting any excess capital to use in the markets.
Of course, with all the excitement in the last week, there’s been quite a significant shift in most volatility/options trading metrics across the board for both BTC and ETH. Not to mention funding rates shifting, liquidation pressure easing up, weekend volumes picking up, and long-term positions starting to accumulate. What began as a relatively exciting but uncertain breakout turned into a full-blown liquidation event. Showing just how quickly the microstructure of the cryptocurrency markets can lead to events that feel as chaotic and explosive as lighting a match in a pool of gasoline.
ATM vs RV for BTC/ETH
Weekly ATM vs. realized vols in BTC trended strongly upward throughout the week, kicking off in the upper 30s and closing the week at 74.9 before peaking on Sunday around 79.08. What began as a slight upward trend quickly turned explosive as realized volatility and price action trended higher pre and post CPI.
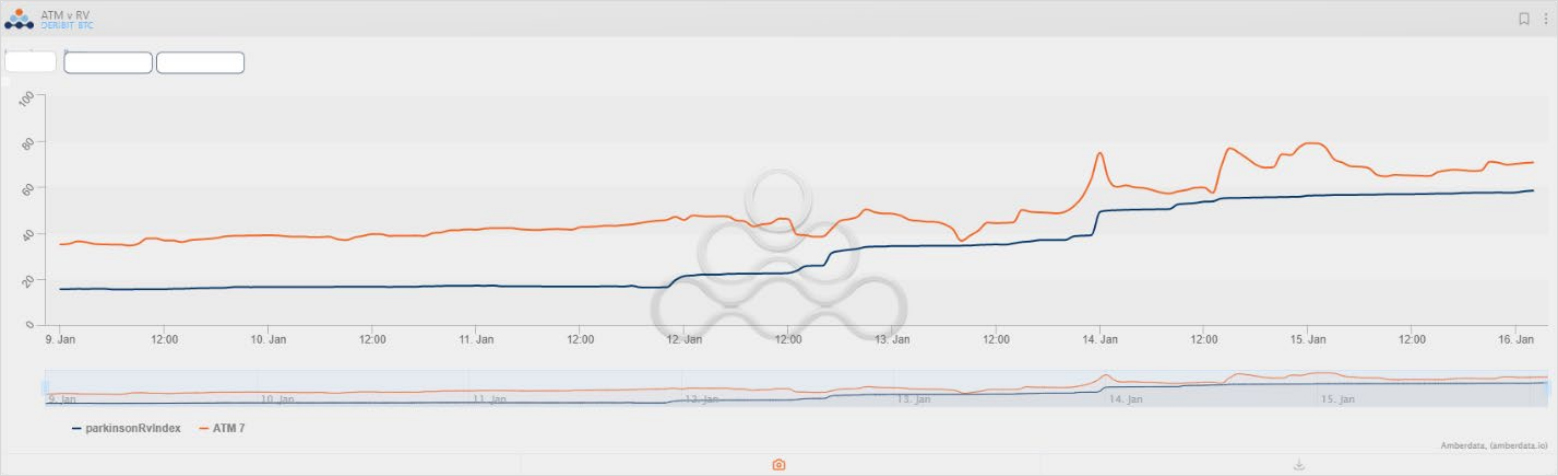
Weekly ATM IV vs. RV (BTC)
In ETH, the same trend in ATM volatility and price action followed that of BTC, and surprisingly at one point, as shown in the chart above, ETH and BTC weekly vols traded relatively close together by a few points. Historically there has been more of a disparity between the two. Still, the end of this week saw all eyes on BTC volume and price, with ETH surprisingly lagging until some more significant liquidations stepped in.
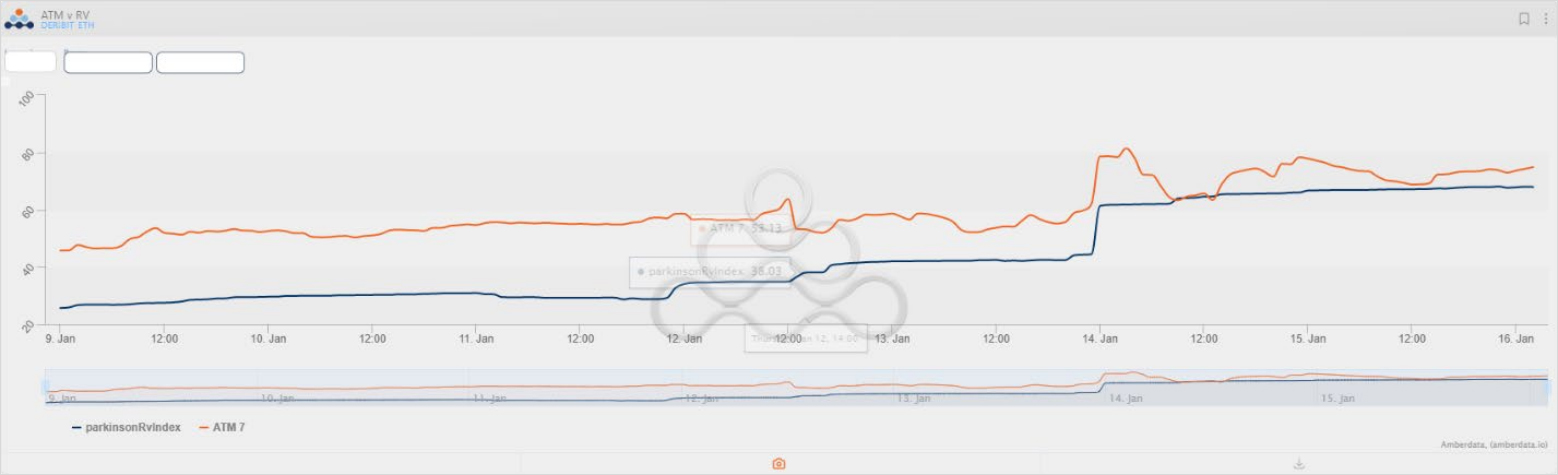
Weekly ATM IV vs. RV (ETH)
Into the weekend, Saturday saw trading volumes historically larger than most previous weekend trading sessions, and BTC spot (Coinbase) tested new highs at the end of the Sunday trading session. ETH traders should be focused on the $1,600 level, while BTC traders should keep a close eye on the $21,000-$21,500 range.
Skews for BTC and ETH
The 25-delta skew in BTC options (measured call-put) on a weekly/monthly timeframe now trades relatively biased toward upside calls at a 6-7 IV premium. Although we saw bullish price action to end of the week, it wasn’t until 12:00 UTC on Friday that weekly skew started to pick up, with call demand picking up as momentum-driven trades speculating on upside price movement began to accrue. The richness in the call skew has persisted throughout the weekend as bullish sentiment starts to pick up.
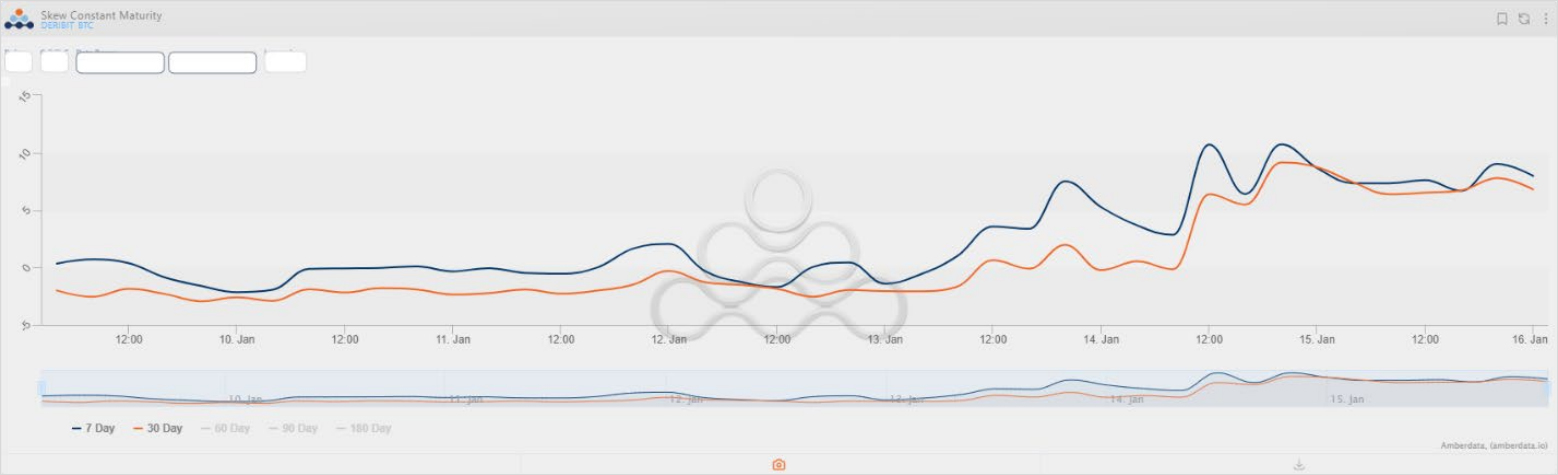
BTC Weekly/Monthly Skew
In ETH, a similar mid-single digital elevation in call skew is apparent. However, monthly 25 delta calls trade only 1-2 IVs higher than 25 delta puts, suggesting longer-term bullish sentiment in ETH lagging a bit behind that of BTC. There is also another narrative to think about in the medium/long term for ETH regarding the Shanghai network upgrade. Historically (as seen with the ETH merge), most interest in any event-based trades start to pick up a bit closer to the date of the event.
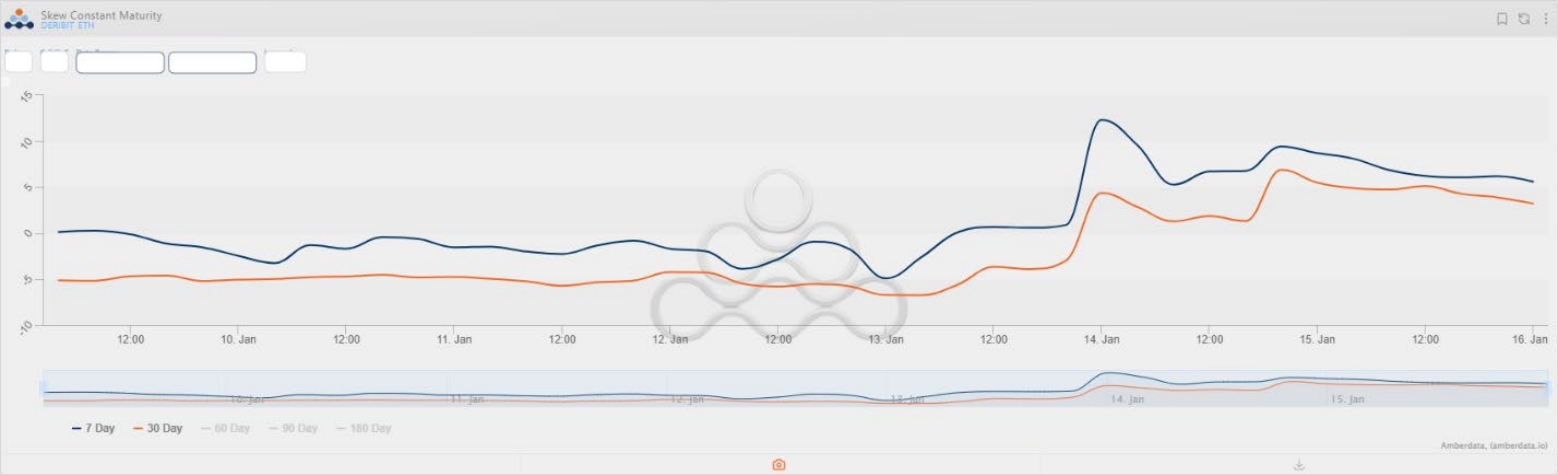
ETH Weekly/Monthly Skew
In a chart created by BlockScholes, we see the monthly SABR volatility smile showing a definitive elevation pickup in IV across the board. However, as one can see, from Tuesday to Post-CPI (Grey vs. Yellow), skew in the put tails had seen a slight elevation while calls of similar delta did not see the same degree of elevation. While the curve shifted across the board, it wasn’t until traders had been exposed to the volatile price action Friday and Saturday that a steeper smile started appearing in the upside tails.
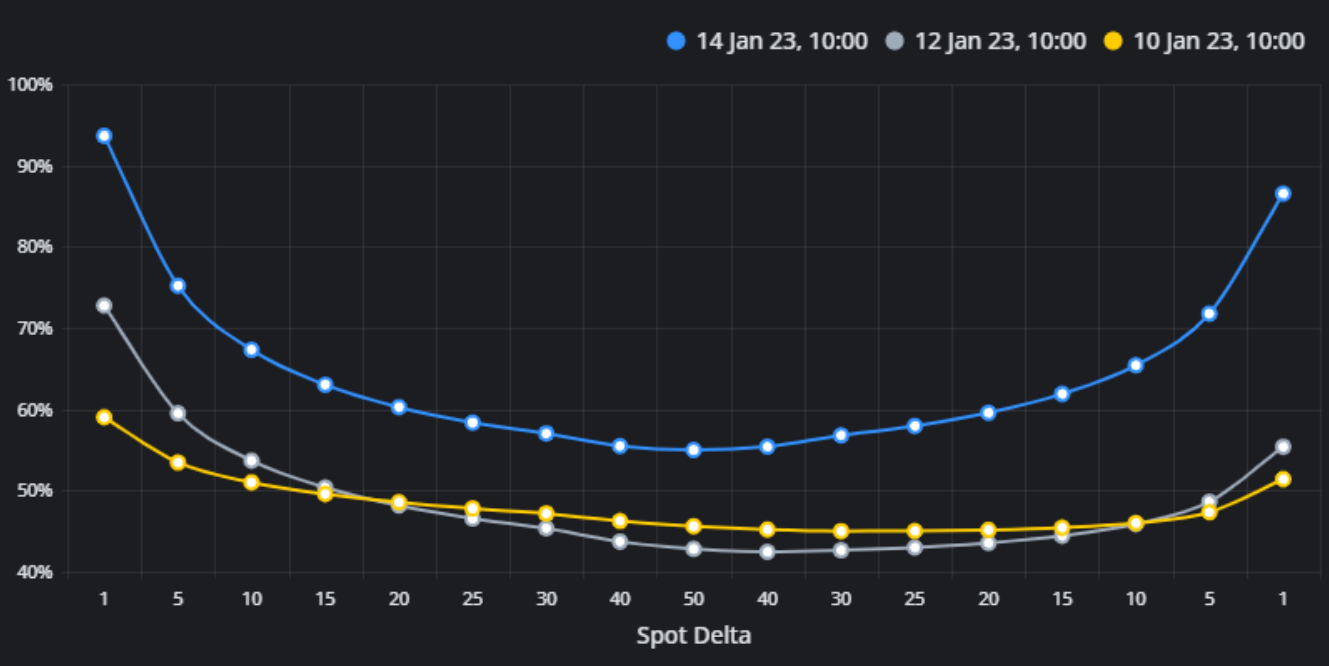
BTC SABR Volatility Smile (Monthly) by BlockScholes
Term Structure for BTC and ETH
Starting last week, we saw a relatively normal term structure in both BTC and ETH, both curves were trading in contango with a noticeable kink in the expiries post-CPI. Looking at the term structure in BTC heading into the weekend (two days ago), we see term structure in sharp backwardation – typical of a market trading with elevated volatility in the short term.
As we can see, heading into the weekend, the curve appears elevated across the board, with the monthly ATM expiry picking up 9 IVs. This elevation in implied volatility across the curve is relatively flat up until March 31st , with expiries further dated picking up a bit less. Take note of the kink in the February 3rd expiry, as this is the expiry most exposed to direct moves resulting from the FOMC meeting.
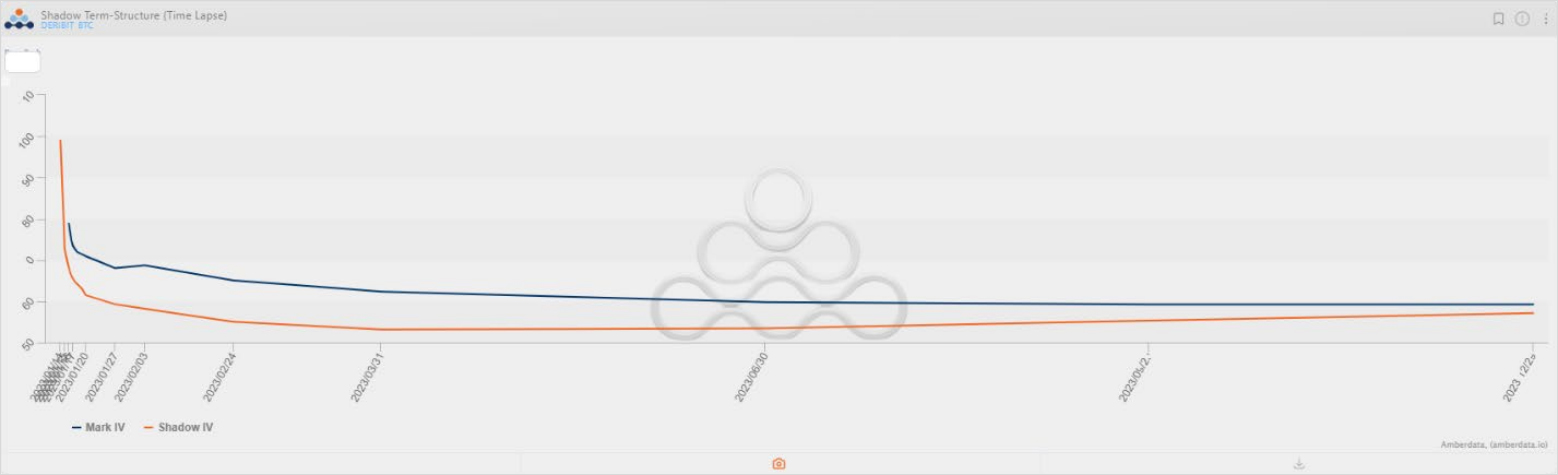
BTC Term-Structure (2 Days Ago to 00:00 UTC Monday)
ETH shows a similar trend in terms of a pickup in volatility across the curve, but there is a noticeable difference in the term structure of the near-dated expiries. The past week saw ETH lagging the gains of BTC until Friday, when a massive liquidation in ETH perpetuals resulted in a short-term double-digit increase in the price of ETH. In the spot market, the 5-minute candle in BTC showed a 2.82% gain compared to a 5.08% gain in ETH shown below.
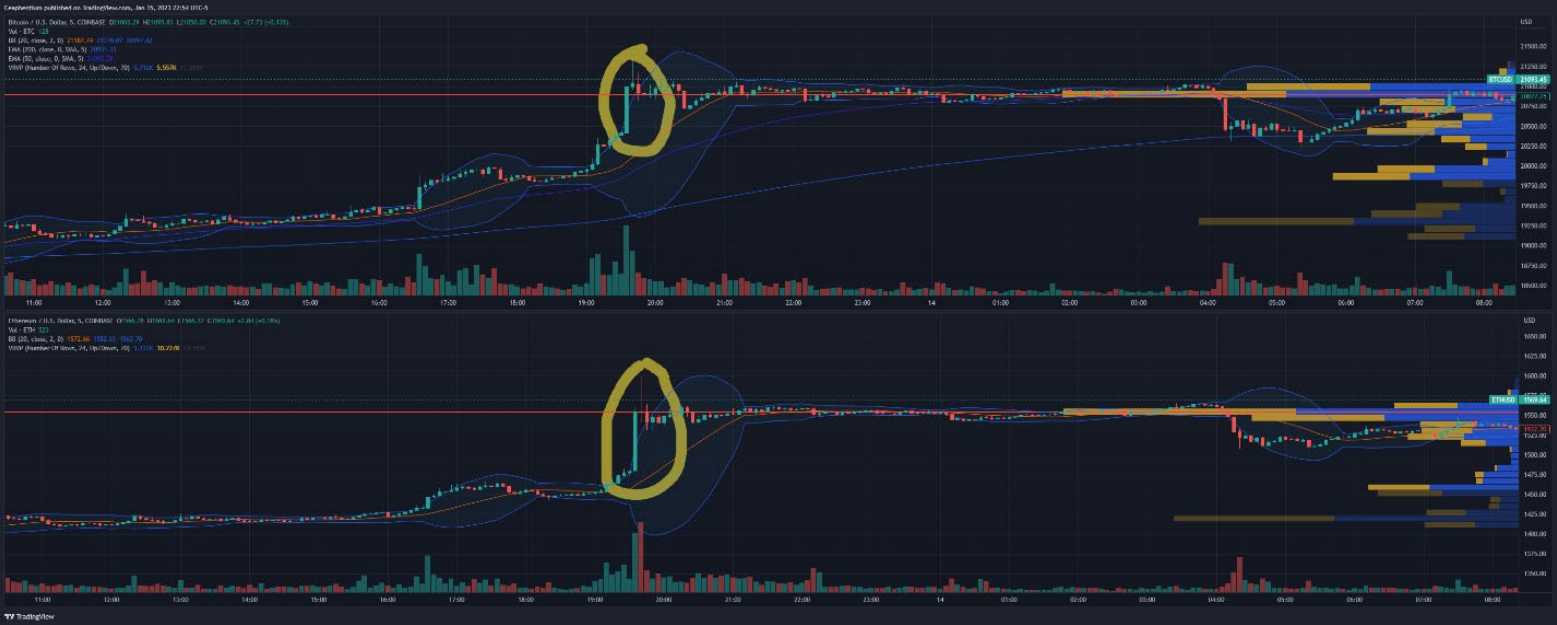
Price Comparison of ETH/BTC on Friday
Perhaps this most recent “catch-up” in price action seen in ETH – the typically higher beta crypto asset – is a cause for this interesting discrepancy between the term structures. It would appear that on Friday, traders forecasted significantly higher volatility in the 1/17 and 1/20 expiries (although liquidity in the 1/17 expiry is relatively low).
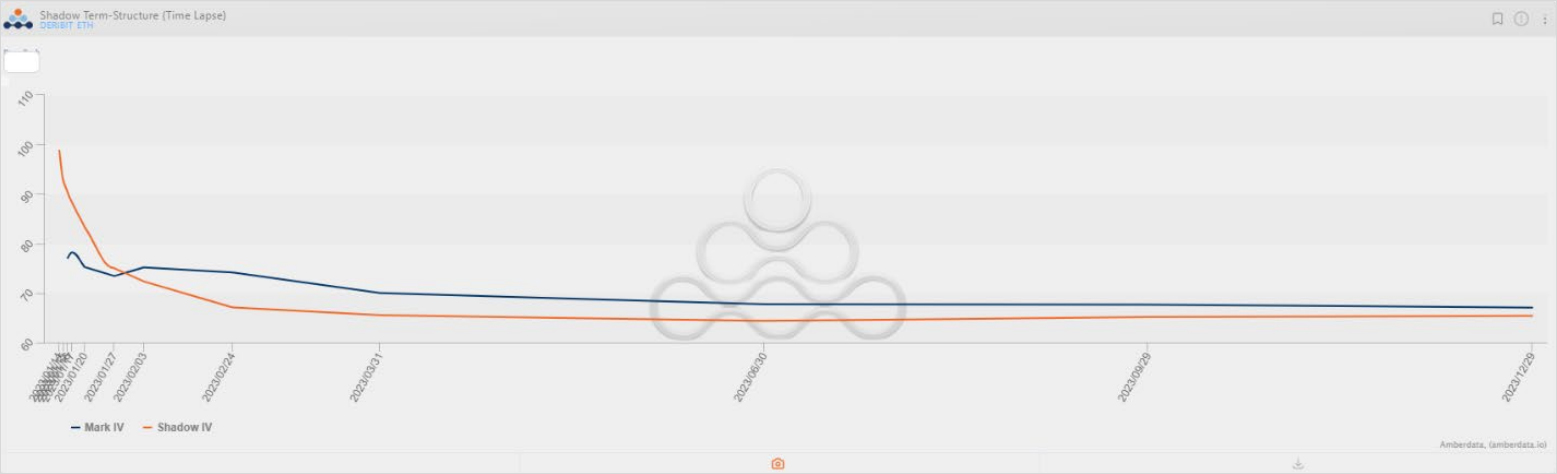
ETH Term-Structure (2 Days Ago to 00:00 UTC Monday)
Noticeable Flows Throughout the Week
While we know the blocks of ETH 400 puts a couple of weeks ago were placed on Deribit screen order books, we saw a decent bit of block trading happening through Paradigm recently. Noticeable flows started with the pre-CPI short-dated gamma purchased Wednesday in the 18K strike expiring BEFORE the CPI print.
Although it’s challenging to pinpoint dealer delta hedging being the primary catalyst for price action, especially given how many factors can impact the price of cryptos, such as short liquidations, liquidity gaps, technical/fundamental views, etc. A large block of short-dated gamma purchased earlier that day coincidentally concluded with a gap up from $17k to $18K that night.
Other interesting block trades last week can be seen in the tweet below by Paradigm, with some of the most noticeable being the $18/19K calls for January 27th expiry, February $17K/20K call spreads, and February $24K outright calls to name a few.
Twitter Thread by Paradigm
Liquidations
Compared to the past few weeks and even months, one can see the massive number of short liquidations catalyzed by some of the recent price action. January 13th saw almost $500m liquidated across exchanges, with a majority coming from OKX and Binance according to Coinglass.
Surprisingly, Bybit, one of the exchanges with the most negative funding rate at one point suggesting one of the strongest bearish sentiments, had only seen around $30m in short liquidations – although we are limited to the accuracy of the data seen in the chart below.
We see around $141m in BTC liquidated across short positions and around $210m in ETH. A similar trend was seen at the beginning of the year, but the ratio of ETH/BTC liquidations this time has shifted much closer towards 1:1.
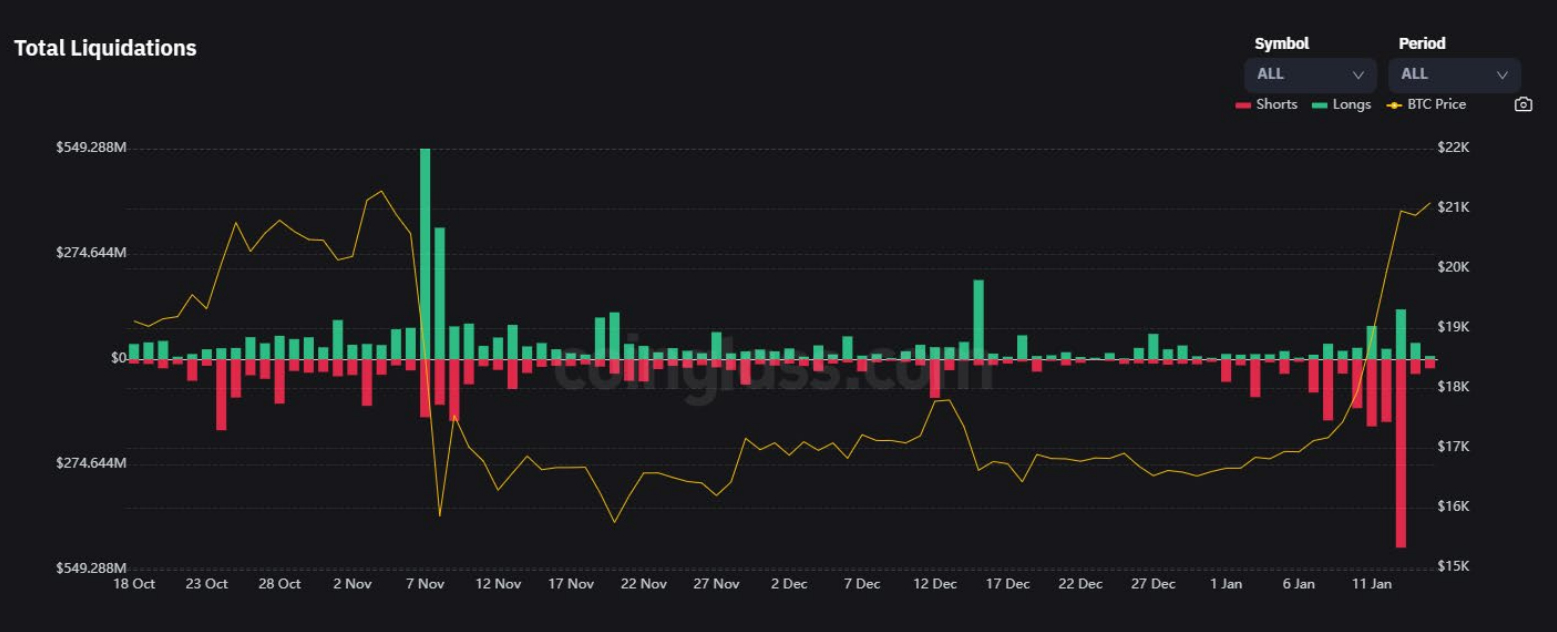
Exchange Liquidations: Coinglass
A Look Ahead
With volatility elevated and a new trading range starting to establish itself, tradable opportunities are sure to pop up in both the ETH and BTC vol markets. Last week was one of those special weeks in crypto where seemingly everything about the market works together to drive an impact on price. Short-term sentiment as seen by call skew, volumes, and option flows slants towards a bullish bias.
Last week saw a surprisingly large amount of short gamma, potentially driving dealer spot hedging which may have led to initial impacts on price, which in turn caused a cascading wave of short liquidations into poor afterhours liquidity on Friday. Of course, with more volume in the markets and less of an overhanging fear of liquidations at current prices (there were more liquidations in the past few days than seemingly the past few weeks) there definitely should be some consideration given to a potential consolidatory period heading into next week, but from a trading perspective – the market feels much livelier and more exciting.
AUTHOR(S)
Chris Newhouse is an OTC Trader at GSR, a crypto native market-maker that specializes in providing liquidity across spot and derivatives markets.