

ETH’s volatility smile is skewed further towards OTM puts than BTC’s.
This is due to a much higher volatility implied by the prices of ETH’s OTM puts, suggesting a preference for protection against downside moves in spot price. However, as this divergence is present across the term structure, it does not appear that this preference for puts is focused on a specific date. Whilst it is not unusual for the volatility smiles of both assets to behave differently, this has more recently been expressed as a higher ATM level of implied volatility for ETH options.
ETH holds a higher Skew to OTM Puts
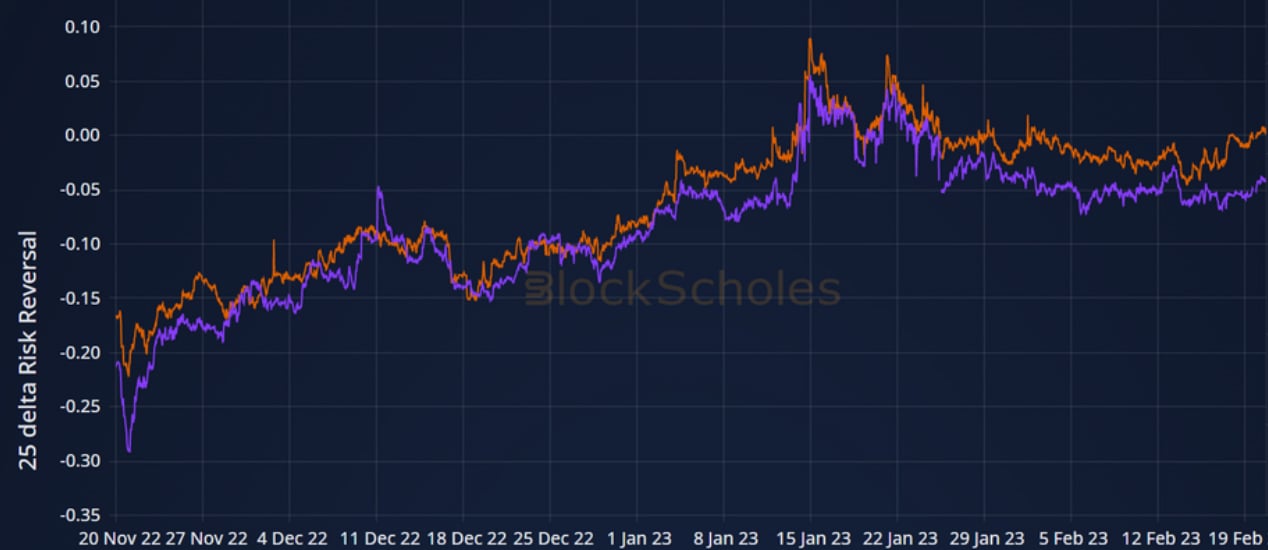
Figure 1 Hourly 25-delta Risk Reversal for BTC (orange) and ETH (purple) options at a 1 month tenor from 20th Nov 22 to 21st Feb 23. Source: Block Scholes
- Both BTC and ETH recovered their months-long skew towards OTM puts in late January.
- In the weeks since, both have returned to a slight tilt towards pessimistic pricing.
- ETH’s 25-delta risk reversal now trades around 5 vol points below zero.
- That is despite the implied vol of BTC 25-delta calls trading on par with 25-delta puts.
Skew is due to higher implied volatility of OTM Puts
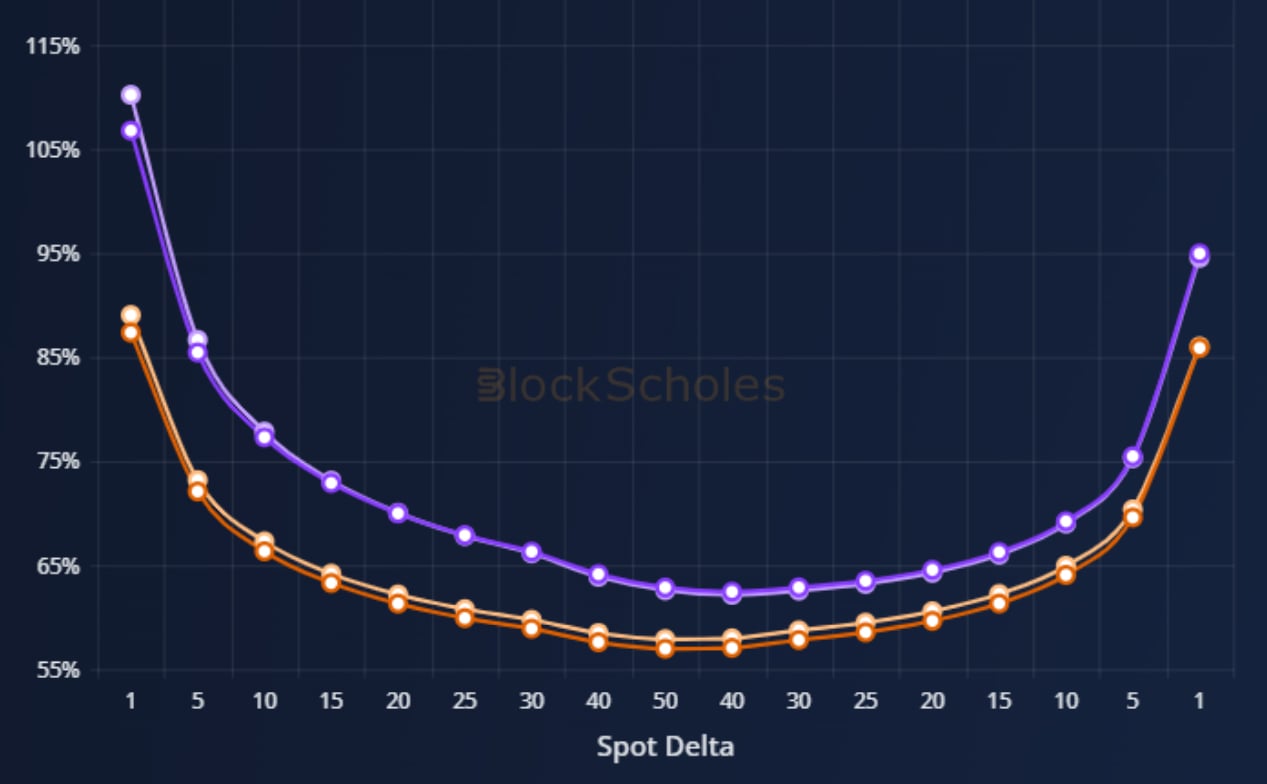
Figure 2 Volatility smiles for BTC (orange) and ETH (purple) at 1 month (lighter shades) and 3 month (darker shades) tenors, taken at a 09:23 21-02-2023 (UTC) snapshot. Source: Block Scholes
- In the hours following the SEC’s announcement, BUSD was swapped for other stablecoin tokens, such as USDC or USD.
- That selling caused a brief but significant depeg in the tokens value against the dollar, before recovering to near $0.9999 at the time of writing.
- This is evidenced by Figure 1, which shows the composition of the BUSD/3CRV pool on Curve Finance’s DEX platform.
- This protocol allows users to swap crypto-currency tokens in a decentralised manner, with the price determined by the ratio of assets in the pool.
- The chart shows a significant increase in the proportion of BUSD in the pool during the early hours of Feb 13th as the SEC announced their decision.
- An increase in BUSD in the pool indicates that their was an excess of traders eager to sell BUSD to the protocol and buy 3CRV (a token that “averages” the price of three other major stablecoins USDC, USDT, and DAI) from it.
- However, that selling stabilised soon after as other traders were willing to buy BUSD below its peg-price of $1.
Term structure
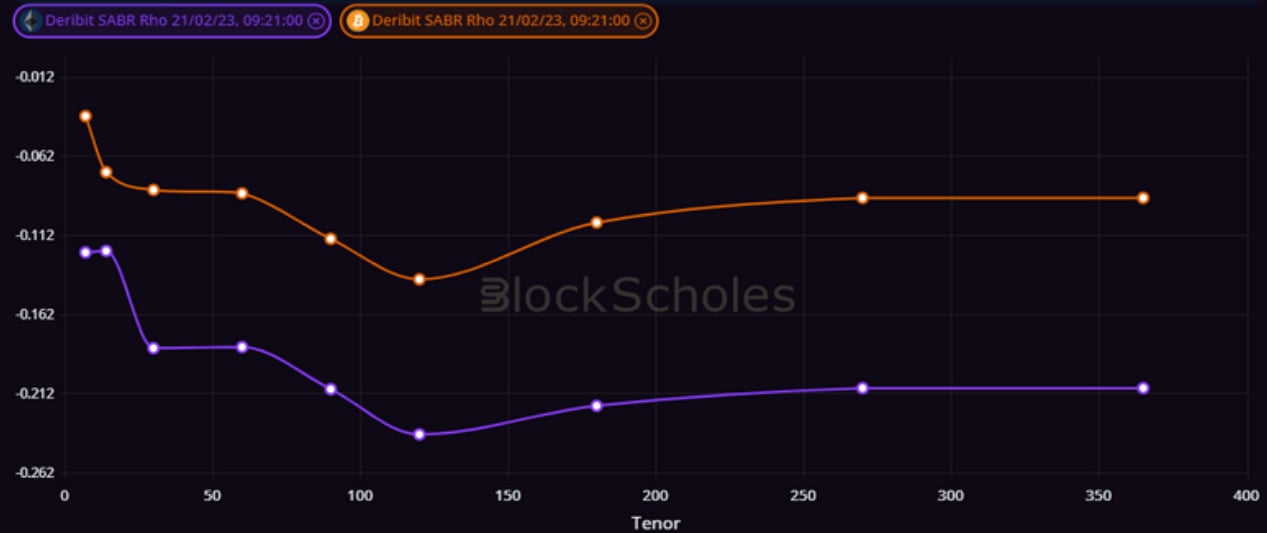
Figure 3 Term structure of SABR rho parameter for BTC (orange) and ETH (purple) options markets from a 09:21 21-02-2023 (UTC) snapshot. Source: Block Scholes
- Both assets show a higher skew towards OTM puts at longer tenors, with the implied volatility of shorter-term puts and calls trading much closer to par with each other.
- The divergence between assets is present across the term structure, with a slight widening to the spread at tenors longer than 2 months.
- As it is present at all tenors, there is little evidence to suggest that this divergence is targeting a specific, future event.
AUTHOR(S)
Trading with a competitive edge. Providing robust quantitative modelling and pricing engines across crypto derivatives and risk metrics.