
BTC is trading with historically low realised volatility.
That is reflected in its options markets, which price for a similarly historically low implied volatility. The skew of the volatility smile has also made significant shifts towards a more neutral pricing. However, it is a drop in bearish anticipation, rather than an increase in bullish belief, that has caused the move towards a more neutral sentiment in volatility markets.
Volatility
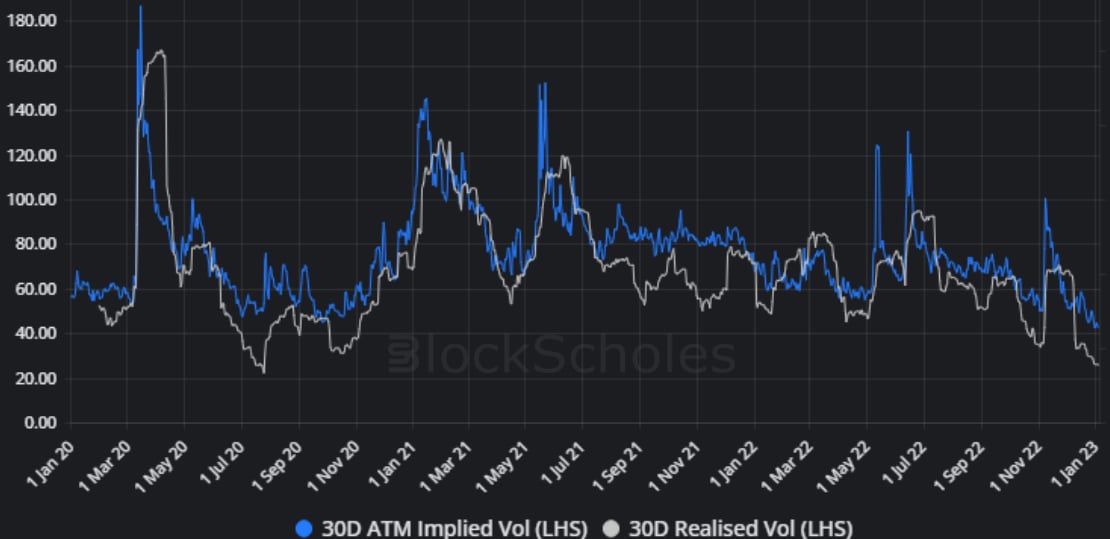
Figure 1 Daily SABR calibrated, 30-day ATM implied volatility (blue), and historical volatility estimated from a 30- day rolling window (grey) from 1st Jan 2020. Source: Block Scholes
- BTC’s ATM implied volatility has reached its lowest value in three years (for a 1M tenor option).
- It now trades at just 40%, down from highs of 100% recorded as recently as during the FTX crash in November.
- This historically low implied vol follows an extended period of low realised vol that is also near to the bottom of its historic range.
- That range-bound, sideways movement has come to define the last year of price action for cryptoassets, apart from several sharp selloffs that saw prices significantly further than equities’.
Skew towards OTM Puts
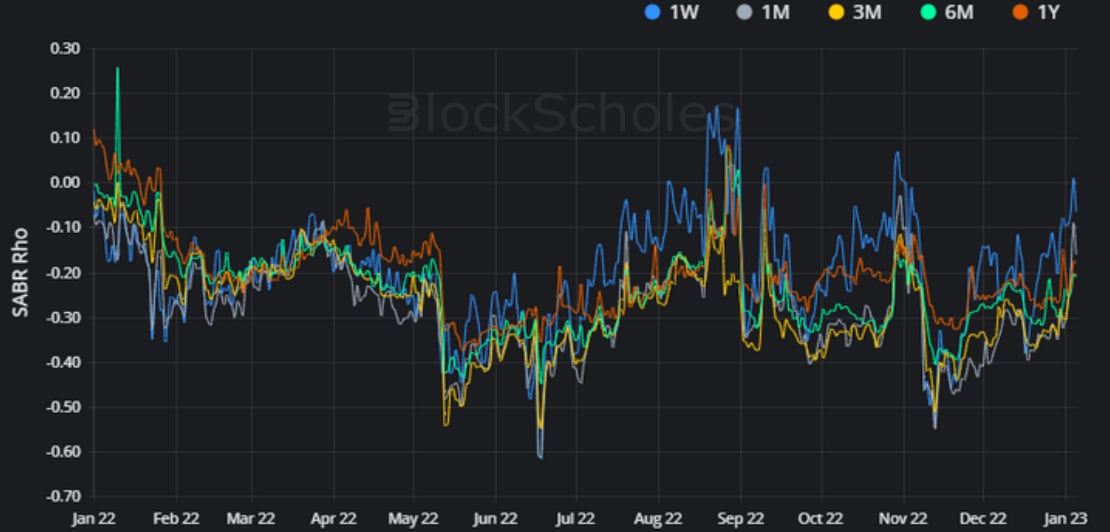
Figure 2 Daily SABR calibrated rho at several constant tenors (legend top right) from 1st Jan 2022. Source: Block Scholes
The SABR Rho parameter corresponds to the correlation between the underlying asset and its implied volatility parameter in the SABR calibration used to model the volatility smile. It also controls the skew of that calibration towards OTM puts or calls. Positive values indicate a premium of OTM calls relative to puts, whilst a negative value indicates the market’s preference for OTM puts.
- However, that range bound action means that the downside moves anticipated by the volatility smile’s skew towards OTM puts have not materialised.
- As a result, the skew of the volatility smile is now moving closer to the neutral levels that we saw just before news of FTX’s insolvency.
- This is because of a fall in the richness assigned to OTM puts, rather than an increase in the demand for OTM calls.
Volatility Smile changes
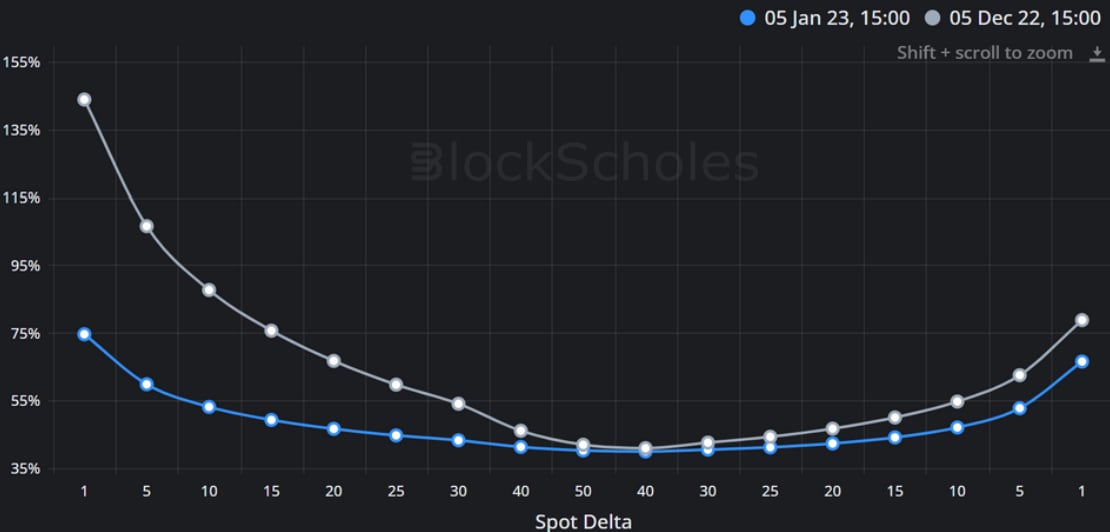
Figure 3 SABR calibrated volatility smiles for the 5th Jan 2023 (blue) and the 5th of Dec 2023 (grey). Source: Block Scholes
- The volatility smiles above show that whilst the levels of implied volatility for the ATM has remained static, and that OTM calls have actually dropped over the past month, OTM puts have fallen much more dramatically.
- This is likely due to traders becoming less concerned about further market contagion (and further market selloffs) the longer that BTC remains range-bound.
- That OTM calls have not seen an increase in implied vol over this period implies that the loss in bearish sentiment has not translated into an increase in bullish sentiment.
AUTHOR(S)
Trading with a competitive edge. Providing robust quantitative modelling and pricing engines across crypto derivatives and risk metrics.