
BTC’s spot price action has shown little correlation to that of US equities, having drastically reduced the co- movement that dominated 2022 over the last year. BTC’s most recent rally means that it has recorded more than a 100% return YTD in 2023, but has also seen a marked increase in implied volatility across the term structure. However, the step-change in spot price has not resulted in a meaningful increase in realised volatility, bringing the ratio of BTC’s implied- to-realised volatility closer in line to the risk premium that has been priced into the VIX since mid- July.
BTC Out-Performing Equities
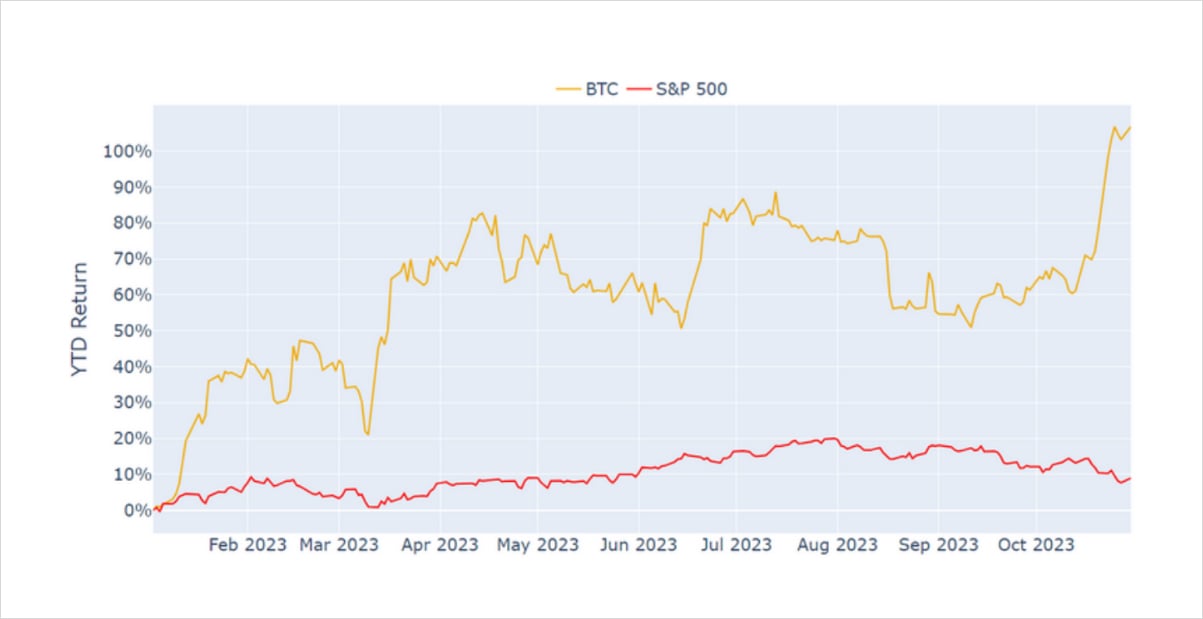
Figure 1 Daily year-to-date return for BTC (yellow) and the S&P 500 index (red) in 2023. Source: Yahoo Finance, Block Scholes
- BTC has posted a 107% return year-to-date in 2023, while US equities are up just 8%.
- This year also saw a dramatic reduction in the correlation of the two asset classes.
- The correlation of their returns over the most recent 30D period has been reported to touch close to zero, which we first highlighted in early July.
Bitcoin’s Volatility Ratio
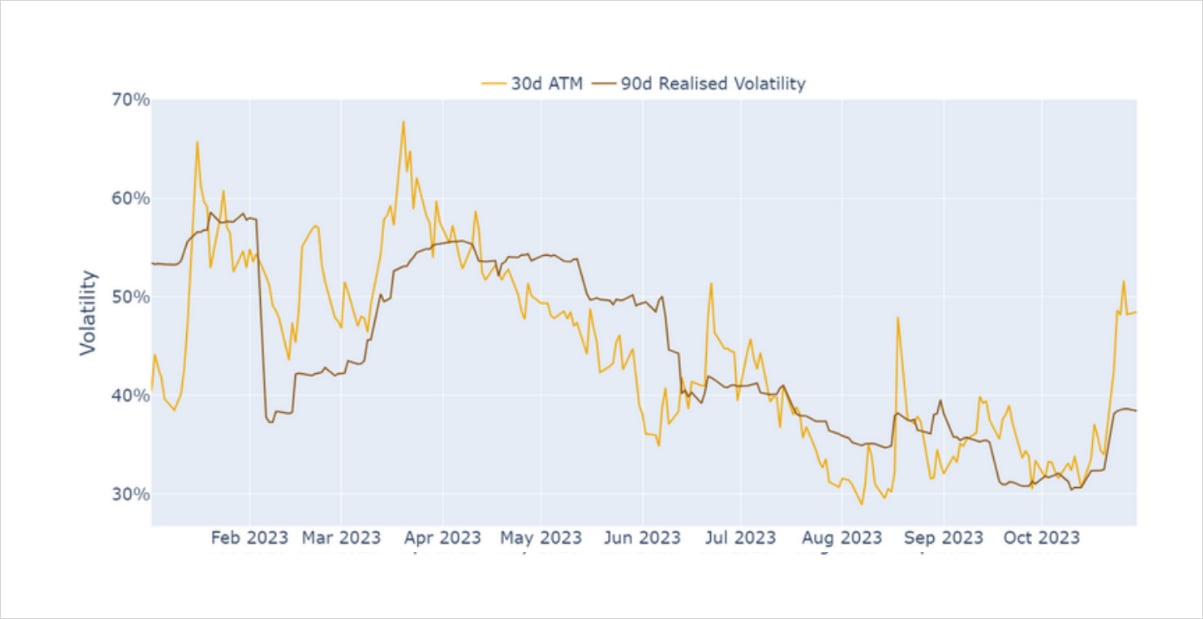
Figure 2 Daily 90-day rolling realised volatility (brown) and 30-day tenor, ATM implied volatility (yellow) for BTC. Source: Block Scholes
- Like ETH, BTC spot action has moved with close to all-time low realised volatility, with the latest step-change in price to $34.5K unable to lift it meaningfully higher.
- However, volatility expectations for BTC over the next month have returned to mid-June levels.
- BTC’s most recent bullish spot priced action has resulted in a significant widening of that spread in favour of implied volatility.
- While a spate of liquidations may have caused vol to rise in reaction to last week’s spot price move, markets continue to price for higher volatility than has been delivered.
BTC and VIX Vol Ratios
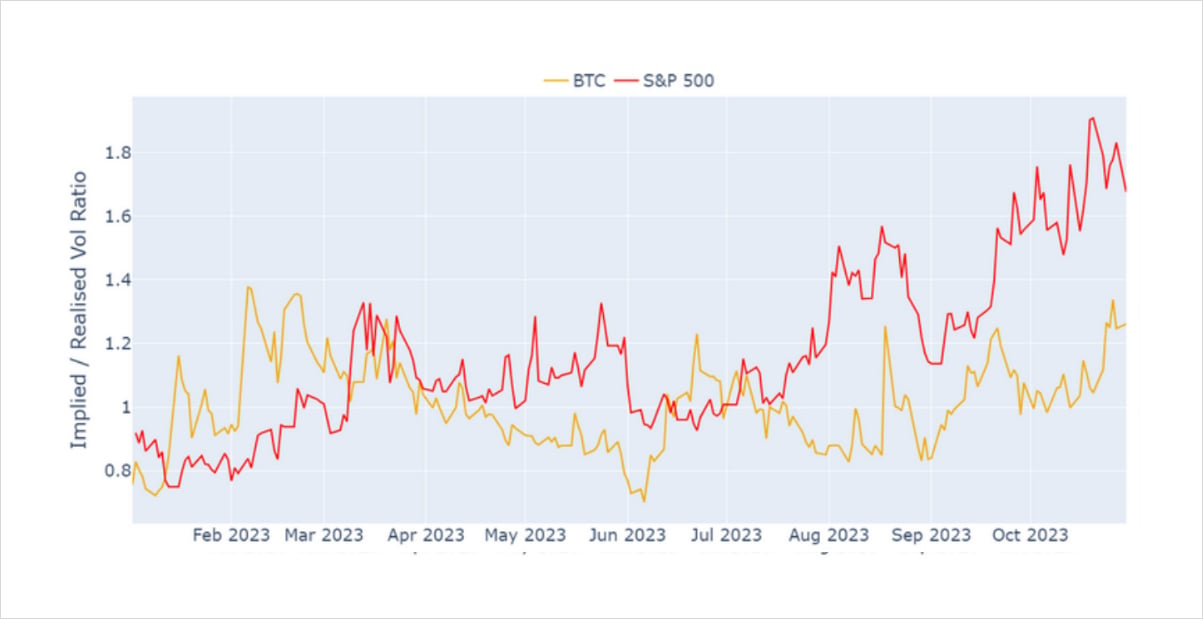
Figure 3 Daily implied-over-realised volatility ratio for BTC (yellow) and VIX/SPX (red) in 2023. Source: Yahoo Finance, Block Scholes
- While BTC and other crypto-assets have increased the ratio of implied-to-realised volatility, it still remains below the ratio of the VIX over the realised volatility of the S&P 500 index.
- We also note that while the VIX has priced in added uncertainty since mid-July, long before BTC’s implied volatility rose in mid-October.
- BTC’s vol ratio is higher for longer dated tenors, owing to a steep ATM vol term structure that sees 3M and 6M vols at 54% and 55% respectively.
- This means that the ratio of their volatility to BTC’s realised volatility is much higher than at shorter tenors.
AUTHOR(S)
Trading with a competitive edge. Providing robust quantitative modelling and pricing engines across crypto derivatives and risk metrics.