

The District Court of New York’s ruling on Ripple may prove to be less of a landmark decision than first hoped by markets, following the faltering of the initial rally last week. Volatility pricing was not materially raised above from its all-time low levels, and continues to price for the levels in the low 40s that we have seen delivered over the last few months. The skew of the volatility smile appears to have settled at a neutral pricing in a similar manner to late 2020, the last time that implied volatility explored new all-time lows.
In Securities
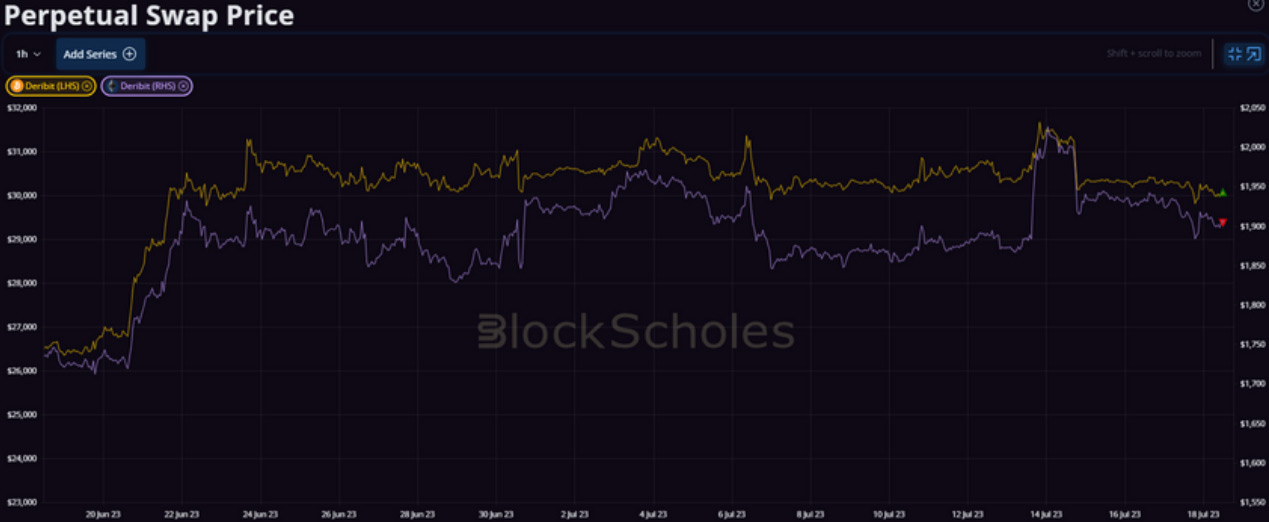
Figure 1 Price of BTC (yellow) and ETH (purple) perpetual swap contracts as traded on Deribit over the last 30 days. Source: Block Scholes
- Crypto-assets rallied following the unexpected ruling by the District Court of New York that XRP is (for the most part) not a security.
- ETH – another token under intense scrutiny from the SEC – rallied harder, rising 7% in a matter of hours to briefly trade above the $2K level.
- Just as quickly, however, it has returned to the low $1900s as the market digested the full implications of the ruling.
Implied Matches Realised

Figure 2 Implied volatility of a 2-week tenor, constant maturity option written on BTC (yellow) and ETH (purple) over the last 30 days. Source: Block Scholes
- Volatility expecations rose swiftly in this period to a local high of 45% (at the 2W tenor), before settling at 37%.
- This is around 3 points lower than the realised volatility observed over the last 90 days at 40.3%.
- Both measures remain still close to their all-time low values, indicating that markets do not see a continuation of last week’s volatility in the near future.
Ripple and Skew
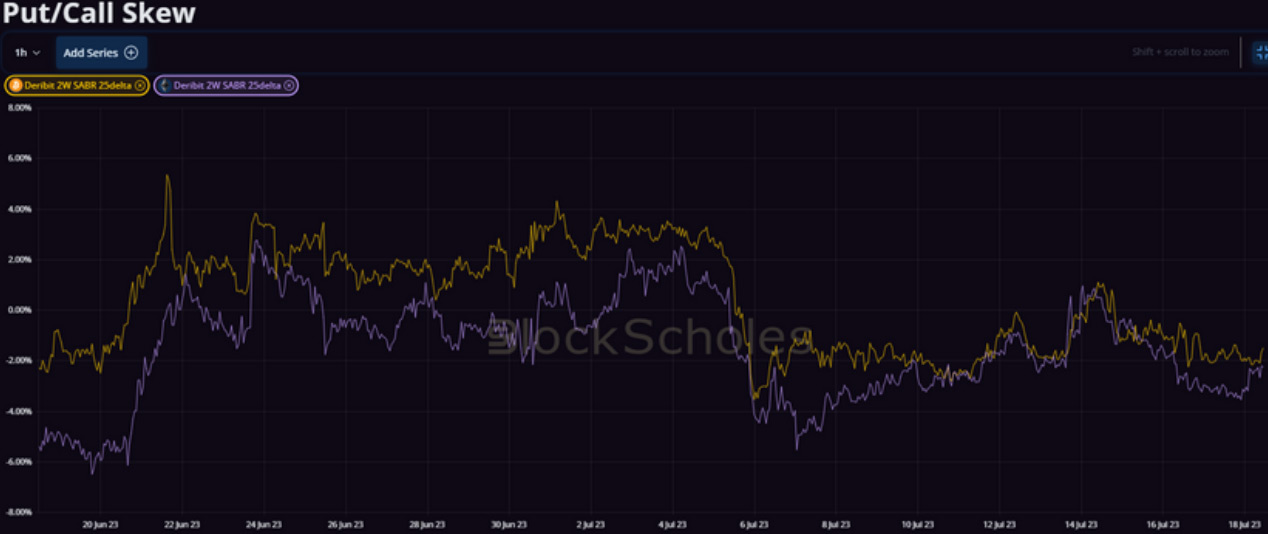
Figure 3 25-delta risk reversal at a 2-week tenor for BTC (yellow) and ETH (purple) over the last 30 days. Source: Block Scholes
- The positive sentiment enjoyed by BTC and ETH in the latter half of June was dashed somewhat in early July.
- This is reflected most vividly in the 2-week, 25-delta put call skew in Figure 3 which shows, excepting some brief departures from the trend, a smile broadly balanced about the at-the-money level.

Figure 4 Scatter plot of BTC 1-month tenor ATM implied volatility (x-axis) and 1-month tenor, 25-delta risk reversal (y-axis) coloured by date (darker points indicate older dates) Source: Block Scholes
- We have generally seen the volatility smile grow more balanced at extreme low levels of implied volatility.
- Figure 4 shows the extent to which implied volatility has fallen given its historical range.
- The range of the vol smile’s skew appears to converge at the current implied vol levels in a similar manner to late 2020 (shown in Figure 4 in dark purple).
AUTHOR(S)
Trading with a competitive edge. Providing robust quantitative modelling and pricing engines across crypto derivatives and risk metrics.