
Both BTC’s and ETH’s volatility smiles have been skewed towards OTM puts since the beginning of 2022, expressing a strong preference for protection against downside volatility.
We are now seeing derivatives markets assign similar richness to OTM calls. These signals are strongest at a 1 week tenor, making 1 month tenor OTM calls look particularly attractive in comparison.
Vol Smile Skew are trending positive
- Out-the-money (OTM) call options are being priced closer to OTM put options than they have been since late 2021.
- Charts 1 and 2 measure BTC’s and ETH’s vol smile skews as the implied volatility of a 10 delta call minus the implied vol of a 10 delta put.
- The implied vols of 1 week and 1 month tenor OTM calls are close to trading on par with the implied vols of OTM puts.
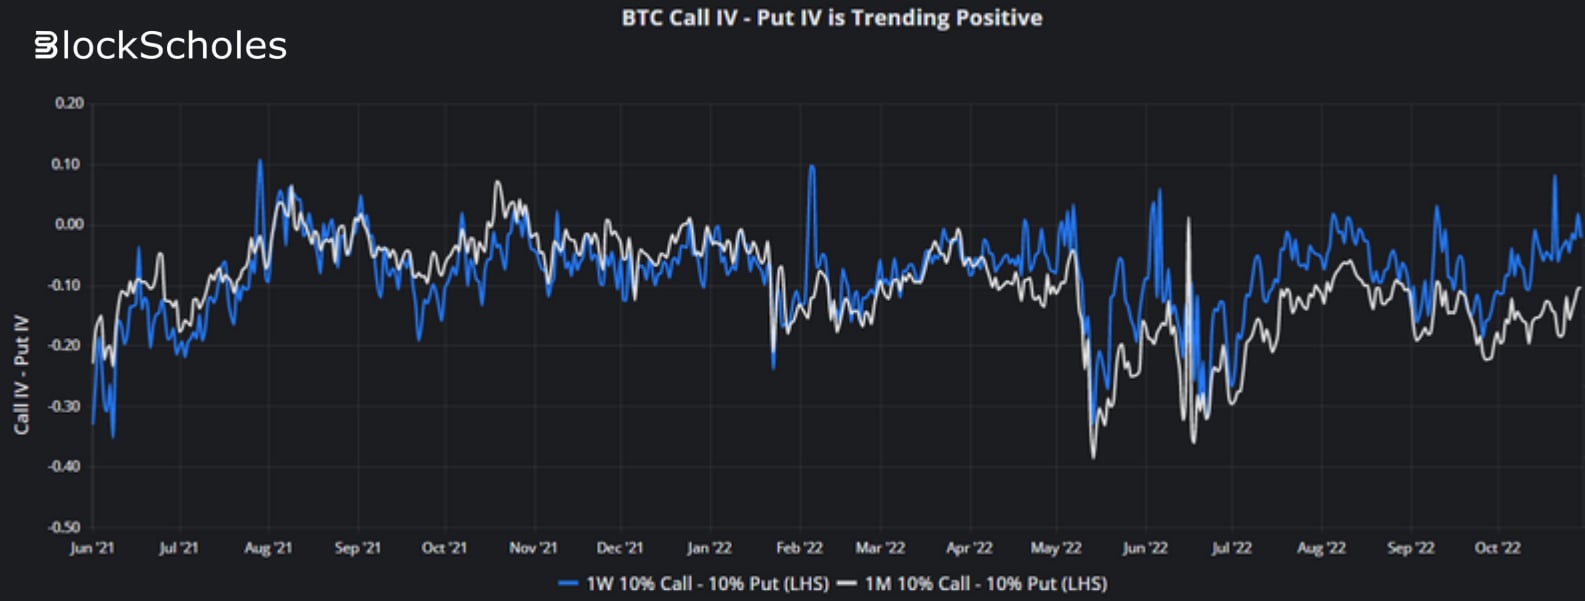
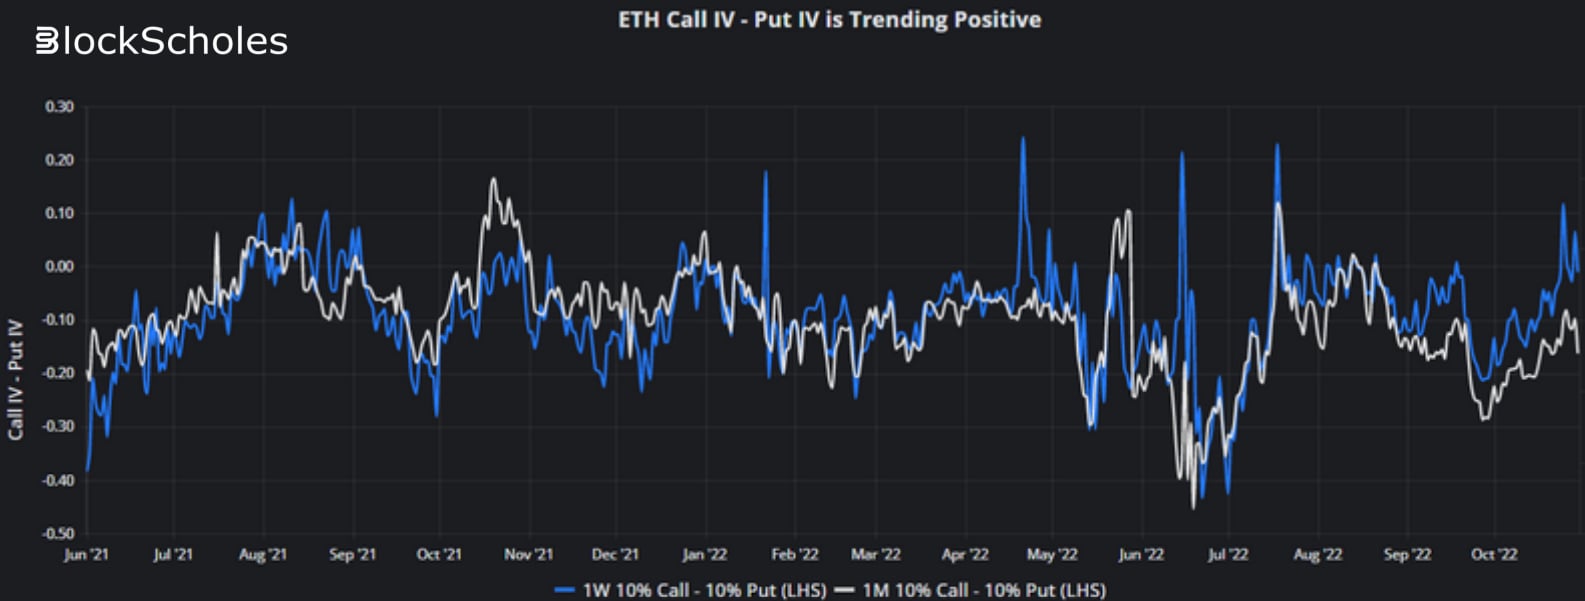
- We see similar divergence between tenors in both crypto-assets.
- The BTC (sub. ETH) 1W expiry currently assigns only a 2 vol point (1 vol point) premium to OTM puts compared to OTM calls, whilst the 1M volatility smile continues to assign a preference for OTM puts, remaining 10 vol points (16 vol points) higher than calls.
Vol Smiles remain skewed towards Puts at longer expiries
- The divergence is clearer in the SABR rho of both tenors (the rho parameter controls the skew of the SABR volatility smile calibration: negative values indicate a skew towards OTM puts whilst a positive value indicates a skew towards OTM calls). We plot this parameter in Charts 3 and 4.
- BTC (sub. ETH) rho is at -0.07 (-0.06) and -0.22 (-0.27) for 1 week and 1 month tenors respectively, meaning that the 1 week smile is skewed towards OTM puts the least this year.
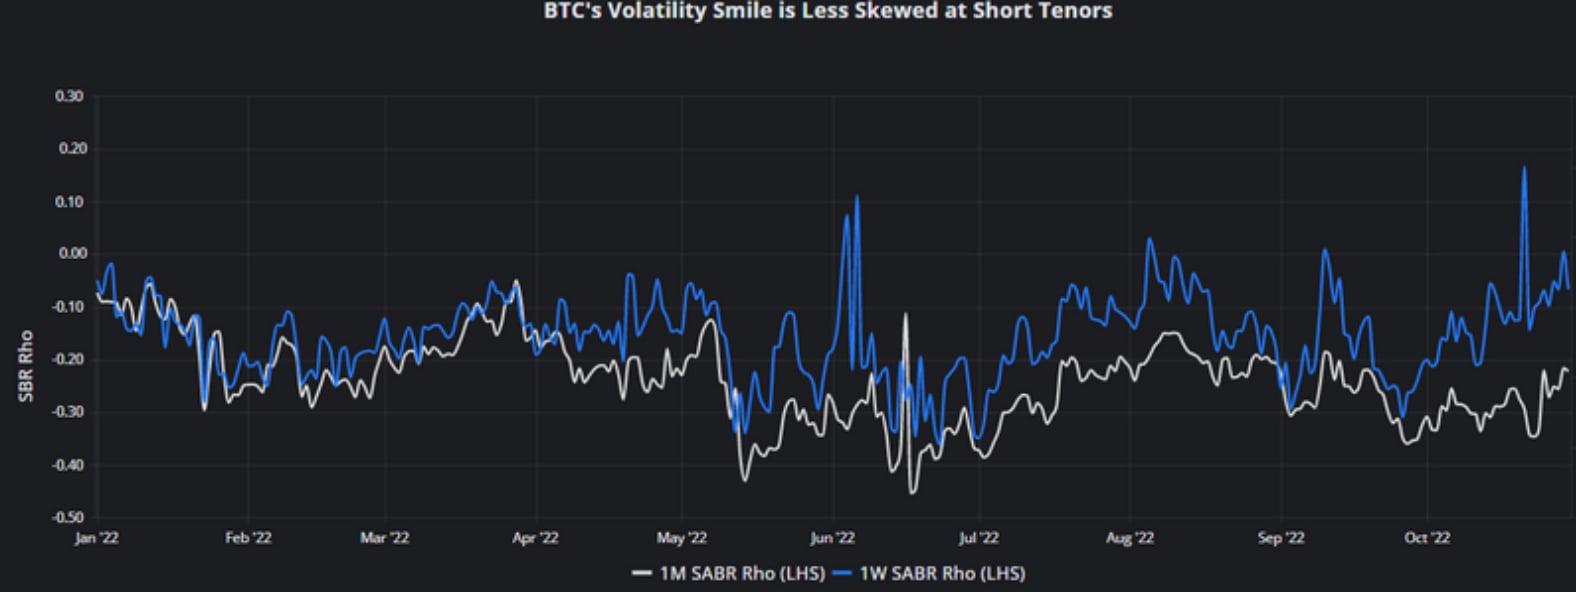
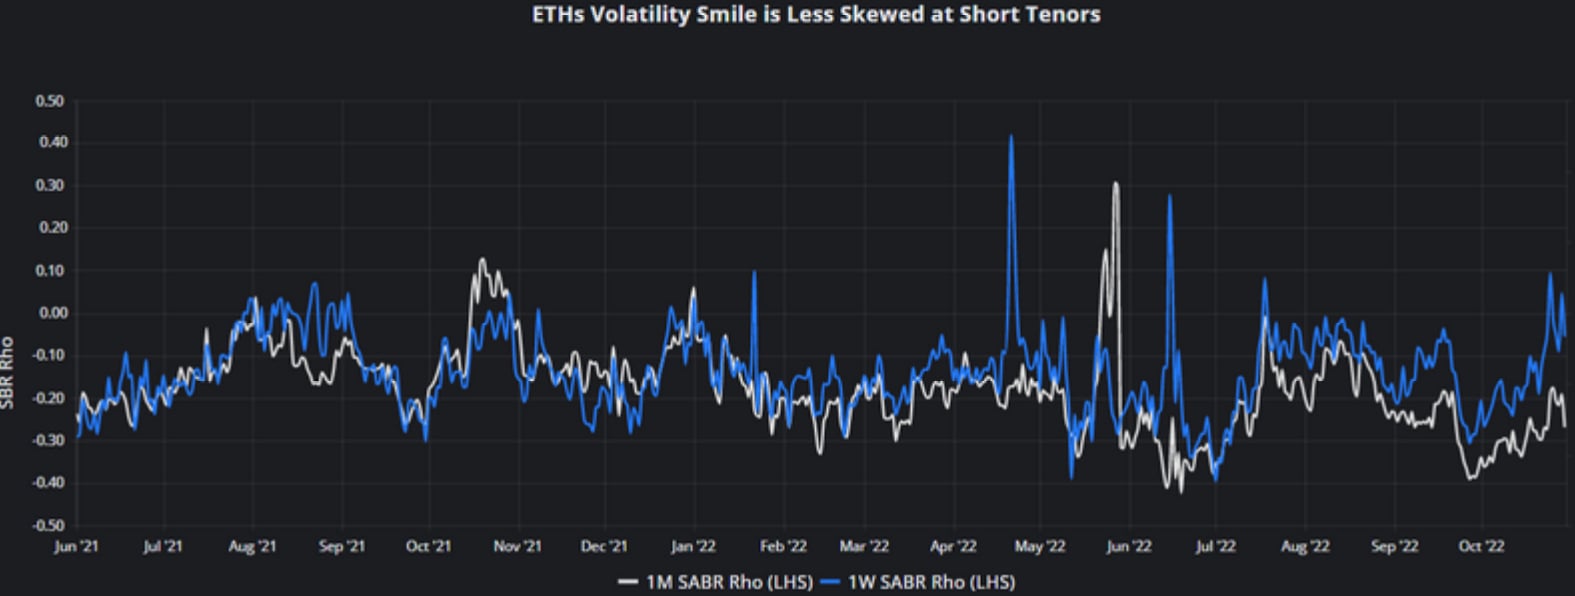
- We also note that, whilst both the rho parameter is trending upwards for both tenors, the difference between them is growing.
- That is true of both assets, and therefore appears to be more than a passing dislocation or mispricing.
One Month OTM Calls are cheap
- Charts 5a and 5b show the relationship between the daily skews of both tenors since the beginning of 2022, measured by both the rho and the put-call skew.
- The trend of both rho and the put-call skew show that the 1 week volatility smile is much less skewed than we would expect given the skew of the 1 month vol smile.
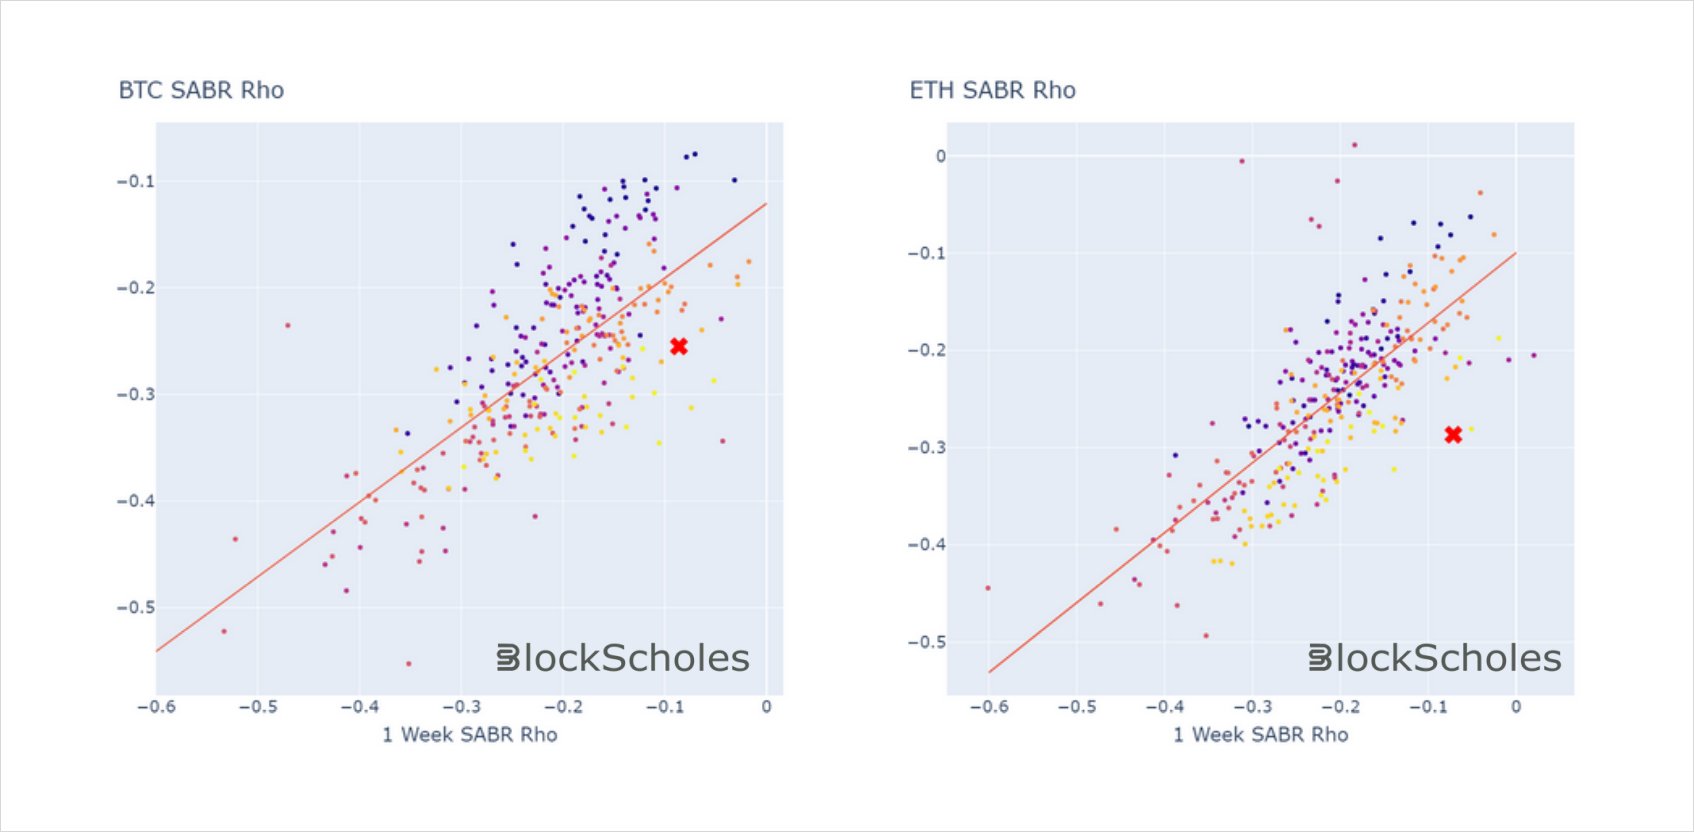
Chart 5a: regression of 1 month vs 1 week put-call skews. Chart 5b: regression of 1 month vs 1 week SABR rho parameter. Darker colours indicate older timestamps, latest timestamp (30th October 22) plotted with a red cross. Source: Block Scholes
Each of these charts indicate that 1 month OTM calls look very attractive compared to 1 month OTM puts given the low skew of the 1 week vol smile. Furthermore, the implied vol of these calls look cheap not only relative to their own short expiries, but compared to other risky assets too. In another Block Scholes report, we highlight the low implied volatility of all BTC options compared to the S&P 500, which it has followed closely throughout 2022. Taken together, each of these dislocations make BTC’s longer tenor, OTM calls look incredibly cheap as the market seems primed for an incoming rally.
AUTHOR(S)
Trading with a competitive edge. Providing robust quantitative modelling and pricing engines across crypto derivatives and risk metrics.