
The implied volatility of ATM options has gradually fallen since the height of this month’s crisis, whilst the implied volatility of deep OTM options remains elevated.
This leaves the volatility smile much steeper and, coupled with an unrelentingly high skew towards OTM puts that we have noted previously, appears to suggest a contradiction in market positioning.
Volatility Canyon
ATM Volatility
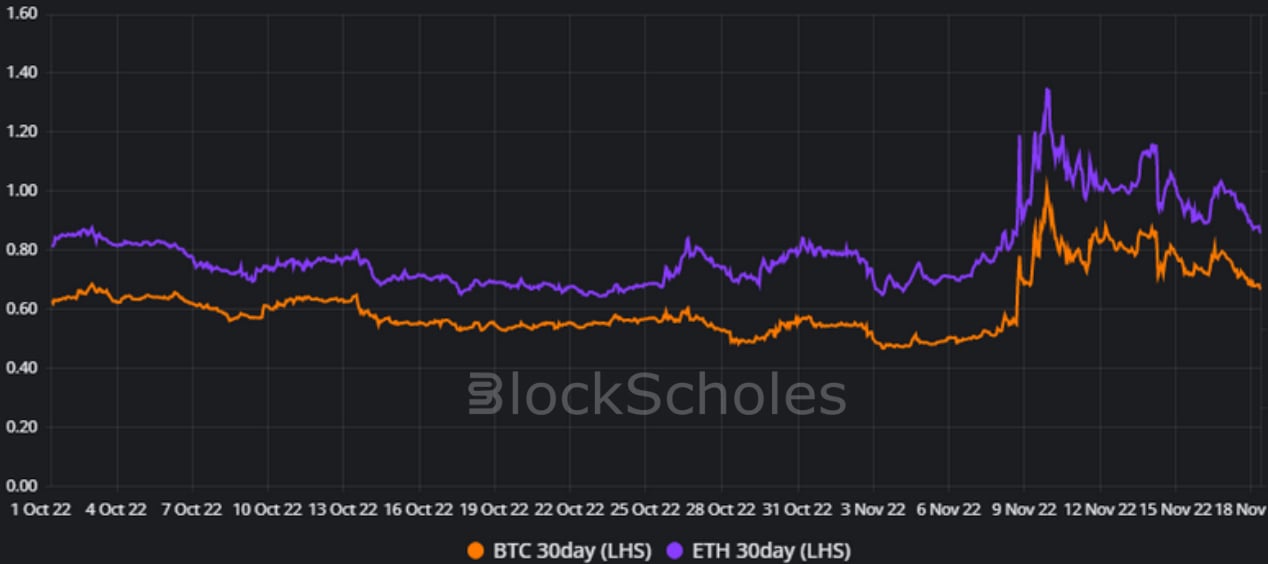
Figure 1 Hourly BTC (orange) and ETH (purple) ATM implied vol at a 30-day tenor from 1st Oct 2022. Source: Block Scholes
- The volatility implied by options struck at-the-money has drifted steadily lower since its spike on the 10th November, leading BTC’s ATM volatility to trade at 66%.
- That is much closer to the 55% level it recorded immediately before the FTX implosion than to the 100% observed at the height of the crash on the 10th Nov.
- We see similar behaviour in ETH’s volatility market, whose ATM vol now trades at 86%, some 49 vol points lower than the 135% implied by ATM options on November 10th.
SABR Vol of Vol
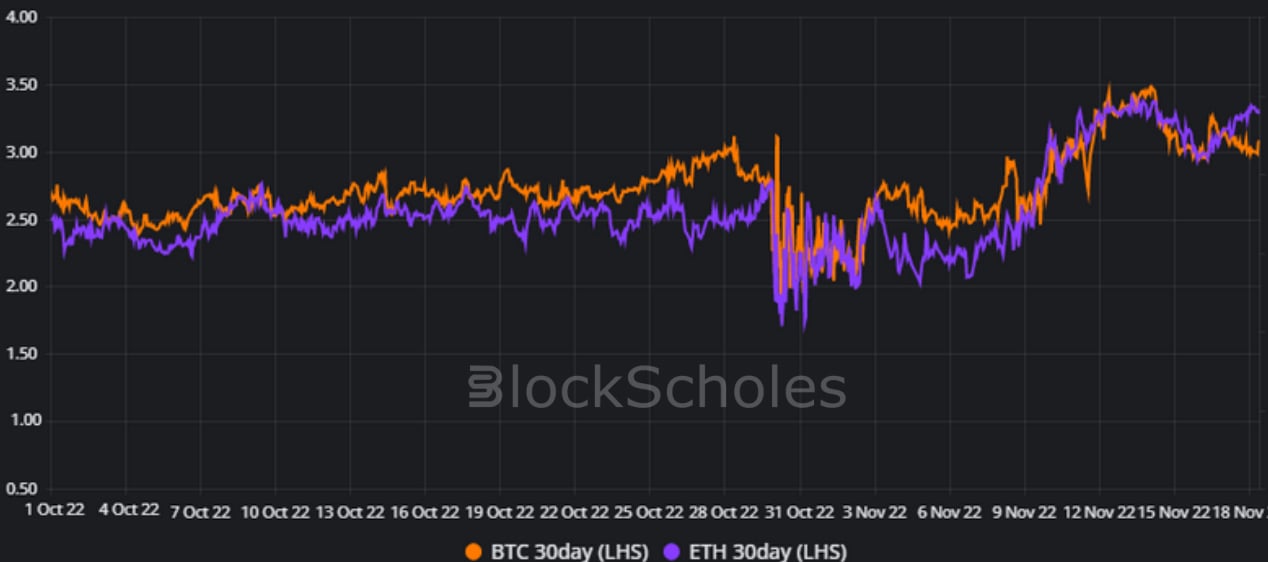
Figure 2 Hourly BTC (orange) and ETH (purple) SABR VolVol parameter at a 30-day tenor from 1st Oct 2022. Source: Block Scholes
The SABR Vol of Vol parameter corresponds to the volatility of volatility used to model the volatility smile. The higher the volatility of volatility, the steeper the smile and the more expensive deep OTM puts and calls are when compared to options struck ATM.
- The fall in ATM volatility levels is in contrast to the elevated levels of volatility implied by options struck OTM.
- As volatility increased last week, so too did the volatility of volatility as worries grew about the direction of the next blow to the market.
- Unlike ATM volatility, however, Vol of Vol has not calmed over the last 7 days. The smile remains steep into the wings, downside protection remains high in demand, and traders remain concerned about further contagion.
SABR Volatolity Smiles
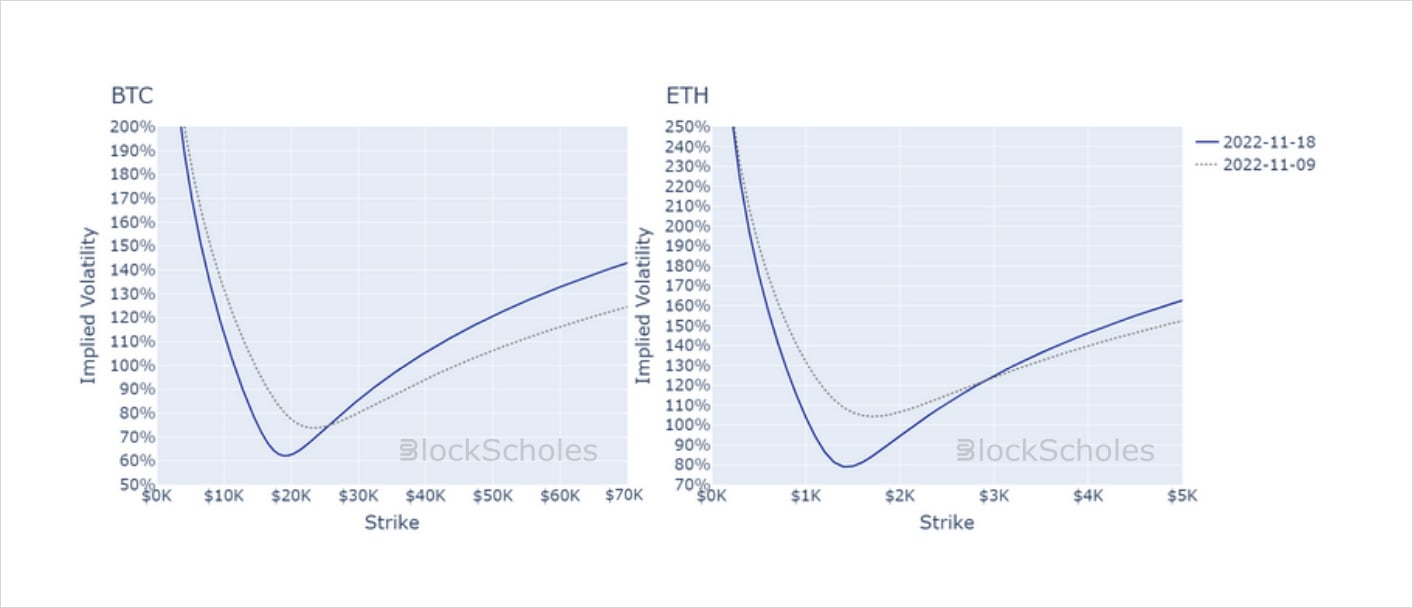
Figure 3 SABR volatility smiles for 9th Nov (grey, dotted) and 18th Nov (blue, solid) showing the evolution of implied volatility ATM and in the wings. Source: Block Scholes
- The increased steepness of the vol smile (as measured by the SABR VolVol parameter) has been caused by a gradual fall in the implied volatility of at-the-money options, whilst the implied volatility of OTM puts and calls has remained static.
- The market is assigning high value to OTM options (particularly to OTM puts) whilst ATM options are being priced close to their value before the spike.
- This market positioning appears to contradict itself. Either the richness in OTM puts is justified by a sharp leg down (in which case we would expect to see ATM volatility spike once more) or the ATM level correctly forecasts low delivered volatility over the next few weeks painting the richness in the wings as overcautious.
AUTHOR(S)
Trading with a competitive edge. Providing robust quantitative modelling and pricing engines across crypto derivatives and risk metrics.