

…and if they are asleep, when is Elon Musk tweeting?
The latest crash surprised many traders and gave an insight of how volatile the BTC can be to the newcomers in the market. High volatility is one of the core attributes of crypto trading, however, there are ways to look out for it that allows for better trade management.
There are certain patterns when it comes to large moves in Bitcoin. Being aware of these patterns are even more important when trading volatility but can also be vital knowledge to integrate into other aspects of your trading, like stop order management for example.
It all comes to the age old game of realised vs implied volatility. What will actually happen vs what we expect. The volatility in options tells us the expected move priced in the market, which usually would have some correlation to the historically realised volatility.
Usually does not mean always. There can be exceptions like a bitcoin halving event where a large move is expected and hence one would expect implied volatility to increase. During the event the large move may or may not happen but the expectation following that is diminished. So you can expect a drop in volatility.
Why not sell options (i.e. sell vega) before the event? One word – gamma! Gamma is the option greek which relates to how much you would lose should we have a large move because of the event.
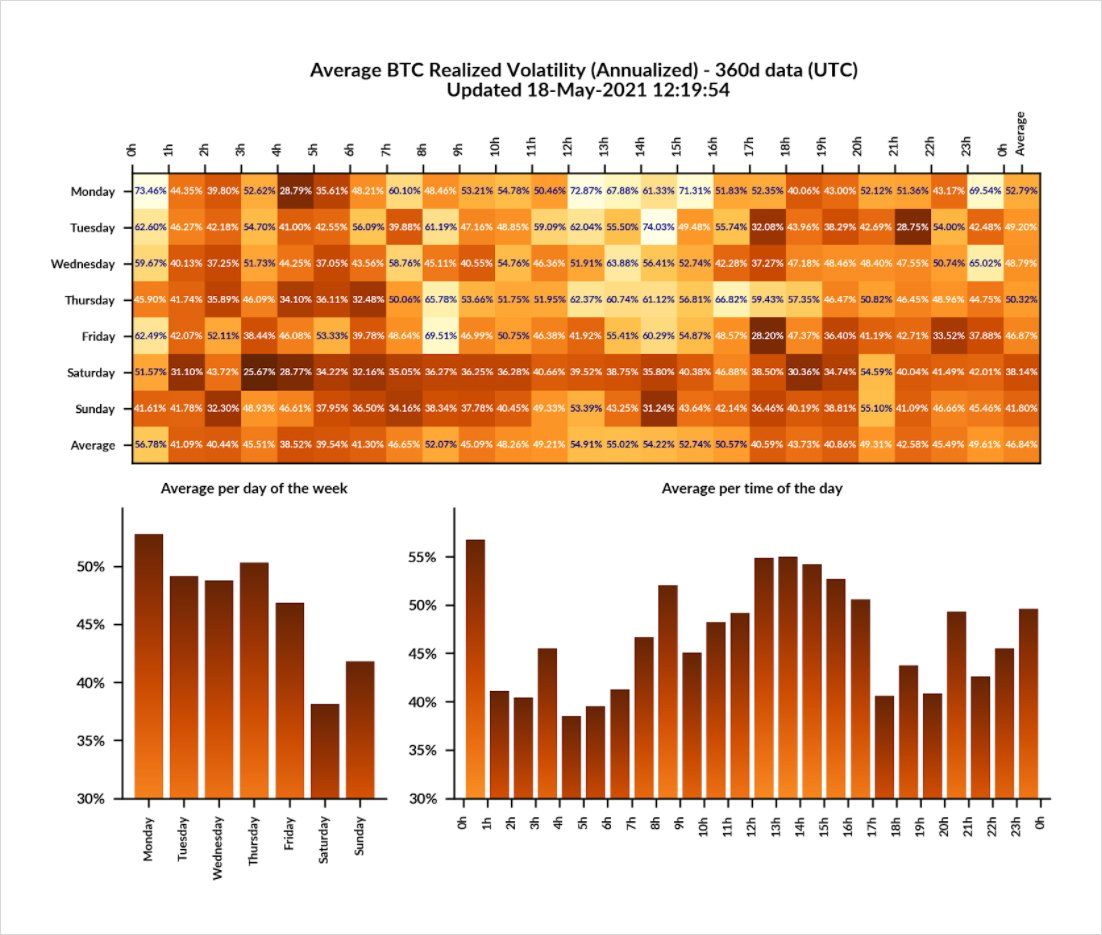
From the diagram above, courtesy of skew.com, looking at the last 360 days of bitcoin moves, we can see certain trends emerging. The weekends, especially Saturday, on average have low activity. The average realised volatility during all the days for the last 360 days was 46.84%. What does this value mean? To get a rough idea, divide by 20 and that gives the average daily move (nearly 2.5%). If the implied volatility of the options was 46.84% throughout, then one strategy might be to sell options early Saturday morning and buy them back before Monday. This way you collect the premium (theta) without losing as much on the gamma.
Instead of adjusting implied volatility based on these patterns, an advanced trader might just have their model setup so that the premium (theta) that runs out of the options is higher during times where larger moves are expected and lower during other times like the weekend.
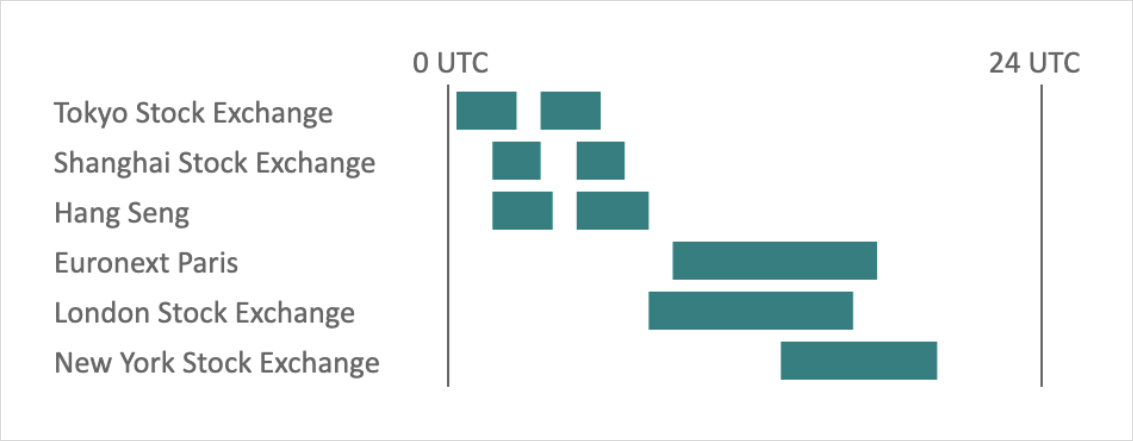
As more institutions get involved in Bitcoin, the timings of the Bitcoin moves give a hint on the geographical power arising from institutional adoption. Whether the large moves happen during the US, European or Asian business hours tell a story. For the past 360 days, most of the moves happened primarily during the European business hours.
Deribit launched its very own Bitcoin Volatility Index (DVOL), and plans to launch futures increasing the possibilities with implied vs realised trading strategies. The DVOL gives 1 number which reflects the 30 day implied volatility in the market at any moment in time. In traditional markets, the volatility index is known as a fear gauge. In bitcoin, we see this as an “action” gauge since the possibilities of large pumps are as common, if not more common, than dumps.
Short summary of the Greeks:
- Vega – gives a measure of how the price of an option changes as volatility changes. Change in option price = Change in Volatility * Vega
- Delta – gives a measure of how the price of an option changes as the underlying price changes. Change in option price = Change in underlying price * Delta
- Gamma – gives a measure of how the price of an option changes as delta changes. A useful calculation is the Gamma PnL = ½ * Gamma * (change in underlying price)^2
- Theta – the flipside of gamma. Gives a measure of how the time value of an option decays each day.