


There are two main types of volatility that we will be talking about during this course. Historical volatility, and implied volatility. To put it very simply, historical volatility looks backwards into the past, and implied volatility looks forwards into the future.
Historical volatility
If we take this chart of the price of bitcoin as an example, historical volatility measures what has already happened on the left side of the chart.
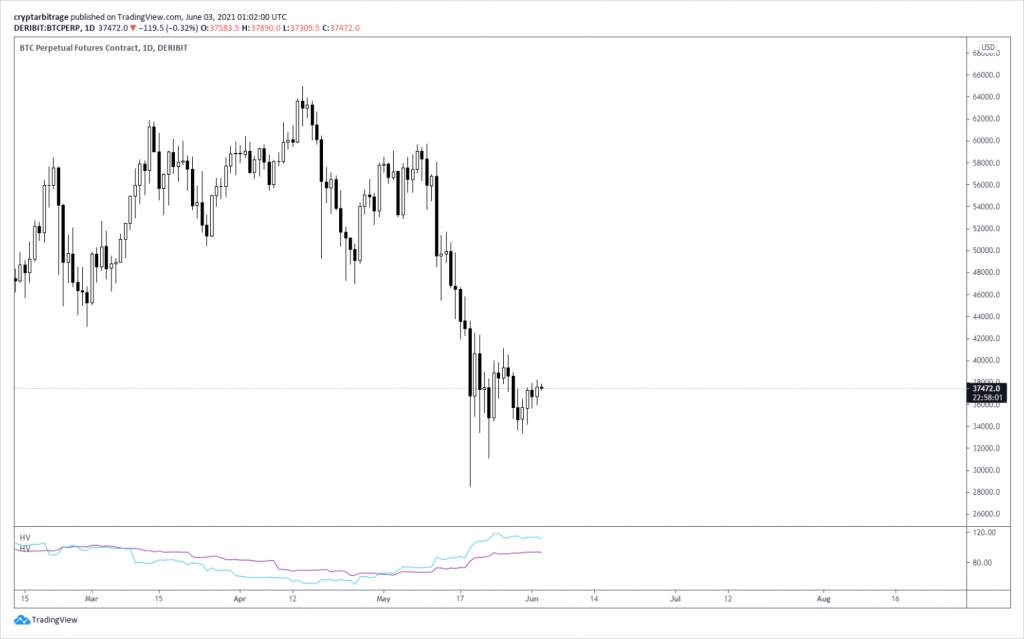
It measures how volatile the price movements have been over a set period of time in the past. At the bottom of the chart I have two historical volatility indicators showing, one measuring volatility over the last 30 days, and the other over the last 60 days; both then displayed as an annualised percentage. While we can measure historical volatility over different time periods like this, giving different figures, they are all a measure of the actual price movements that have already happened.
This can be a useful metric to look at, and will affect market participant’s decisions. However, historical volatility is not based on current option prices.
Implied volatility
Implied volatility looks forward to the right side of the chart. In other words it is a prediction of the future price movements that have not happened yet.
Implied volatility is a measure of the market’s current view of what the future volatility will be. And this view is expressed by the current price of option contracts. Option prices change via the normal market forces of supply and demand. If demand outweighs supply, the price of an option will be driven up, also increasing the implied volatility. A higher option price will of course push the breakeven price of the option further out of the money, meaning price has to move further for the option buyer to make a profit. This implies that a larger move is expected in the underlying price, so it implies higher volatility in the underlying price.
If supply outweighs demand, the price of an option will be driven down, also decreasing the implied volatility. A lower option price will bring the breakeven price of the option closer to the money, meaning price does not have to move as far for the option buyer to make a profit. This implies that a smaller move is expected in the underlying price and so it implies lower volatility in the underlying price.
An analogy using implied probability
It may help to use a quick analogy using the odds of a wager. If I offer you a bet at even money odds, i.e. you will win $1 for every $1 wagered when correct, your intuition may tell you that the implied probability of this wager is 50%. When you win, you win $1, and when you lose, you lose $1. For the mathematical expectation of this wager to be zero, each outcome (win or lose) must have a probability of 50%. The actual probability may end up being different, but the price I’m offering implies that this is the probability. Thus you could name it the implied probability.
In a similar way, if I offer to sell you an option contract, the price I offer it at, implies a certain level of volatility. The future volatility of the asset may end up being different, but the price I’m offering the option contract at implies a certain amount of volatility. And it is this implied volatility that we discuss when we talk about option prices.
Implied volatility makes option comparisons easier
Imagine bitcoin is trading at $36,000. How is it possible to know how a call option that expires in 7 days, costs 0.03 BTC, and has a strike price of $40,000, is priced relative to a call option that expires in 28 days, costs 0.06 BTC, and has a strike price of $42,000. There are too many variables there to be able to make an accurate comparison at a glance. Implied volatility allows us to make such a comparison by normalising the price to an annualised volatility figure.
We can see in absolute terms that the second option is twice as expensive as the first, but when we take the other variables into account, how do the implied volatilities compare?
With a cost of 0.03 BTC, the first option has an implied volatility of about 124.4%. With a cost of 0.06 BTC, the second option has an implied volatility of about 106.0%. As we can now see, despite being a higher absolute price, the second option is implying a lower volatility in future, and therefore may be offering more value to the buyer of that option, and less value to the seller of that option.
The relationship between implied volatility and option prices
The way these figures are calculated is using a mathematical model. Probably the most famous option pricing model is the Black Scholes model. We will cover this in more detail another time, but in basic terms, you plug in the parameters of the option (these include the underlying price, strike price, time left until expiry, interest rates, dividends, and a value for implied volatility), and the output is a price for the option.
You can think of the implied volatility as a way of expressing an option price as an annualised figure. It is the figure that when entered into the Black Scholes formulas as the volatility figure, gives the current price for that option. Assuming the other parameters remain the same, each option price relates to one implied volatility figure and vice versa. If we change the option price, the related implied volatility will also change.
For example, if we use the second call option that expires in 28 days, costs 0.06 BTC, and has a strike price of $42,000. If the price of the option were instead 0.08 BTC, this would mean the implied volatility would be about 125.1%. If the price of the option were instead 0.05 BTC, this would mean the implied volatility would be about 96.2%.
It is for this reason that you will notice a different implied volatility figure for the bid and ask of each option in the Deribit UI. All the other parameters of the option are of course the same, and the only difference between the bid and ask is the price of the option, therefore the implied volatility must also be different. If you have the mark price displayed as well, and it’s a different price to the bid or ask, this will again correspond to a different implied volatility.
The relationship between implied volatility and historical volatility
While implied volatility is a measure of something completely different to historical volatility, that doesn’t mean the two are not related at all. Trader’s views on how the price of an asset is likely to move in the future, are often based on what has happened in the past, particularly the recent past. Therefore the recent historical volatility will often influence what price traders are willing to buy and sell options for. In this way historical volatility can influence implied volatility.
For example, if historical volatility has been very low on bitcoin for several weeks, meaning the price has not moved much, traders wishing to buy options may not be willing to pay very much for them, and traders wishing to sell options may be willing to accept less than usual for them. The reasoning being that they expect the recent low volatility to persist. These lower option prices translate into lower implied volatilities.
If the price of bitcoin then moves down 50% in the matter of a few days, meaning historical volatility will spike up a lot, sellers of options are now unlikely to want to sell them cheap, and buyers of options may be willing to pay considerably more for them. The reasoning being that they expect future volatility to now be higher as well. These higher option prices translate into higher implied volatilities.
So while they are separate concepts, it’s worth being aware that historical volatility will often affect trader’s views of how price is likely to behave in future, and therefore the prices they are willing to buy/sell options at and the related implied volatilities.
Summary
Historical volatility looks backwards into the past, and measures the volatility that has already happened.
Implied volatility looks forwards into the future, and measures the market’s current view of future volatility.
Implied volatility is an option price represented as an annualised volatility figure. Assuming all other parameters remain the same, a higher option price translates into a higher implied volatility, and a lower option price translates into a lower implied volatility.
By looking at prices in this annualised form, it is much easier to make comparisons.