Weekly recap of the crypto derivatives markets by BlockScholes.
Key Insights:
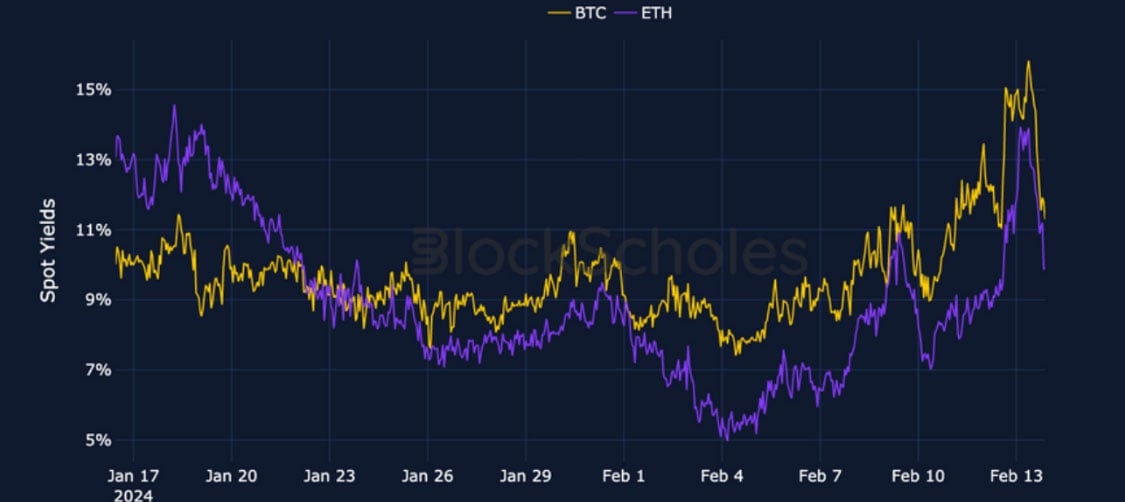
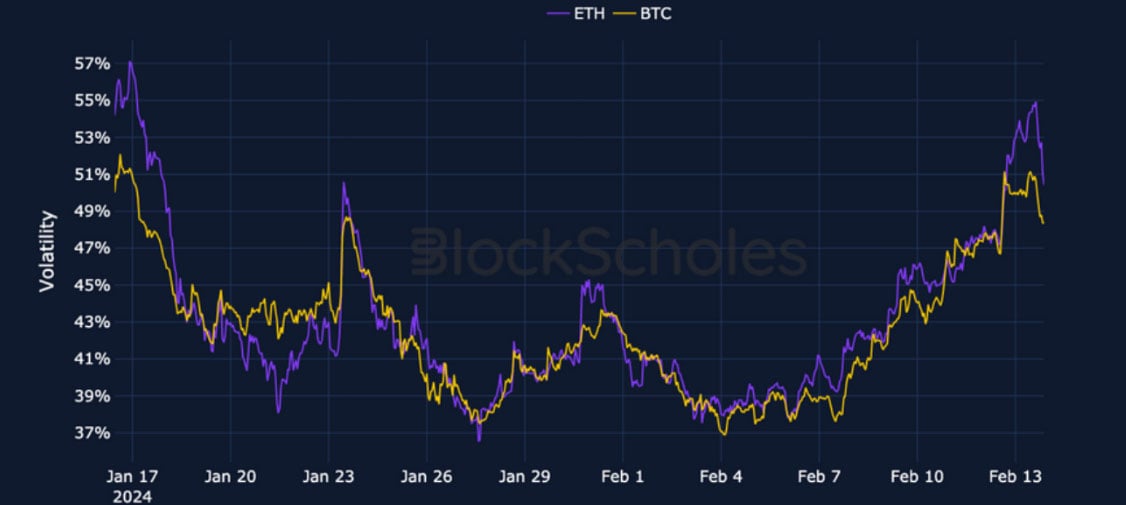
The consistent trend upward in volatility has been followed by each indicator of sentiment. Volatility smiles across the term structure have skewed strongly towards OTM calls, future-implied yields climbed to their values since before the ETF announcement date in mid-January. However, the larger-than- expected CPI print for January has seen a collapse in yields in the last 24 hours and a slight pause in the trending skew towards OTM calls. This has served to moderate the building bullish sentiment, highlighting how tentative market conditions can be under such strong expectations.
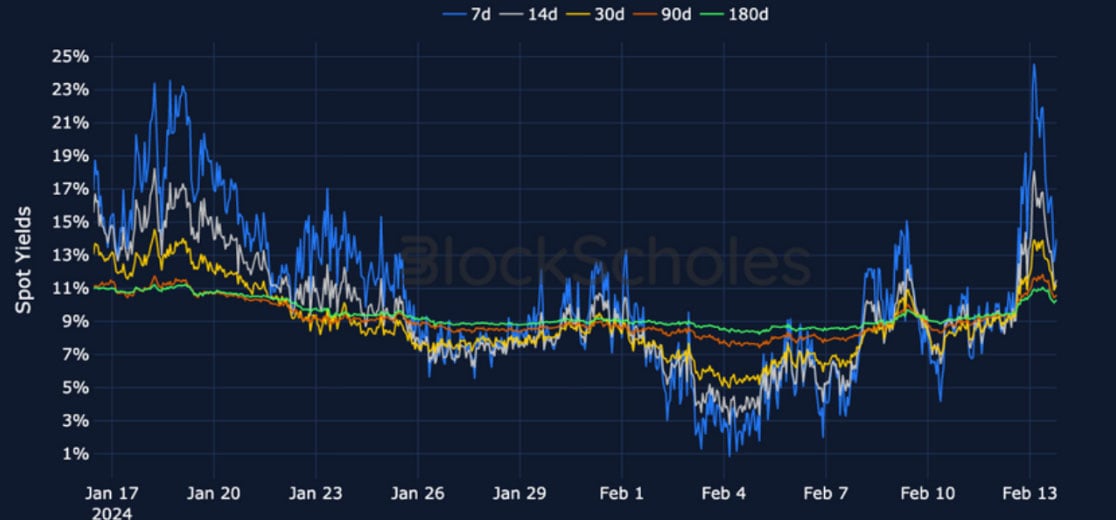
Futures Implied Yield, 1-Month Tenor
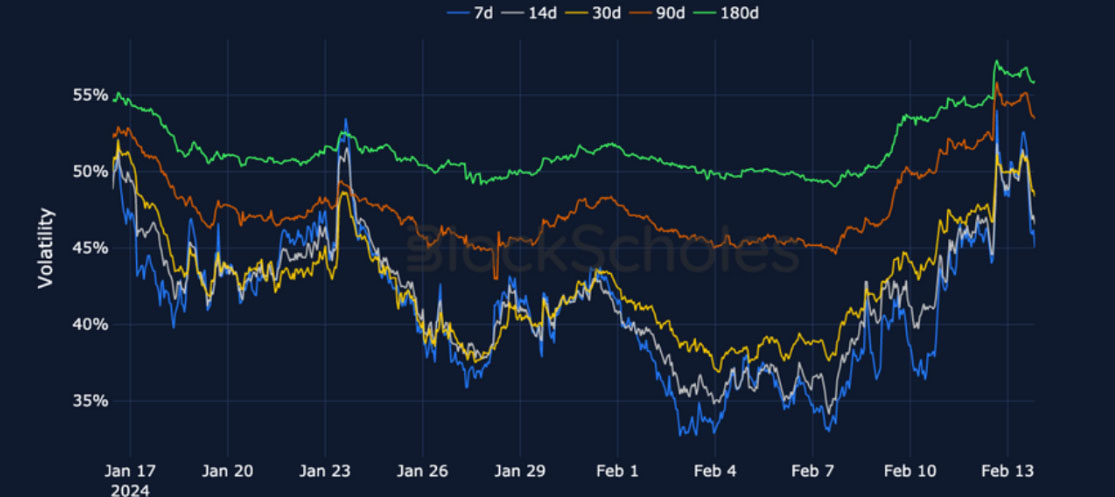
ATM Implied Volatility, 1-Month Tenor
*All data in tables recorded at a 10:00 UTC snapshot unless otherwise stated.
Futures

BTC ANNUALISED YIELDS – rose to their highest rates since the strong bullish sentiment ahead of the ETF, before collapsing post-CPI print.
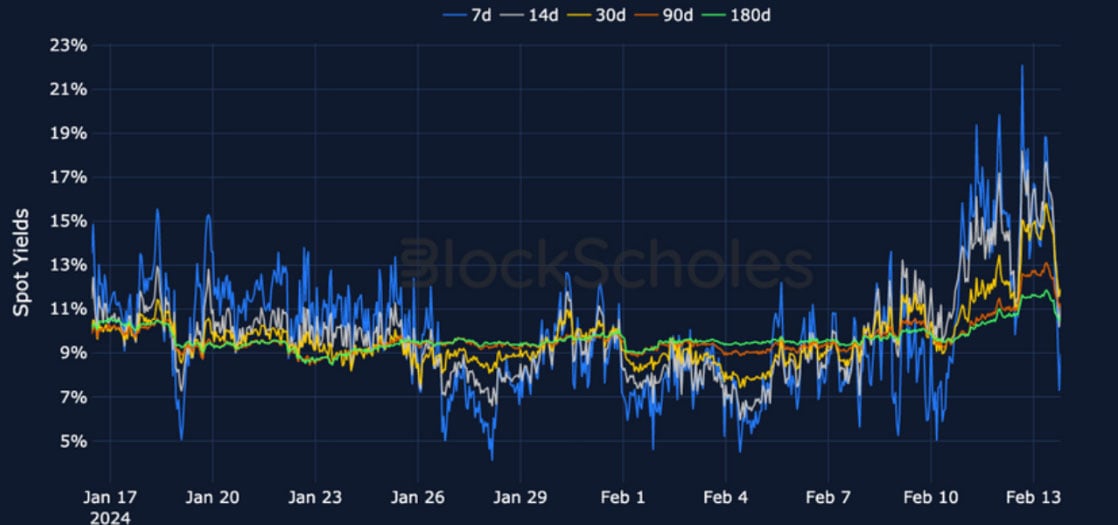
ETH ANNUALISED YIELDS – spiked above the levels of BTC’s, but more suddenly and with less of a collapse following the CPI print.
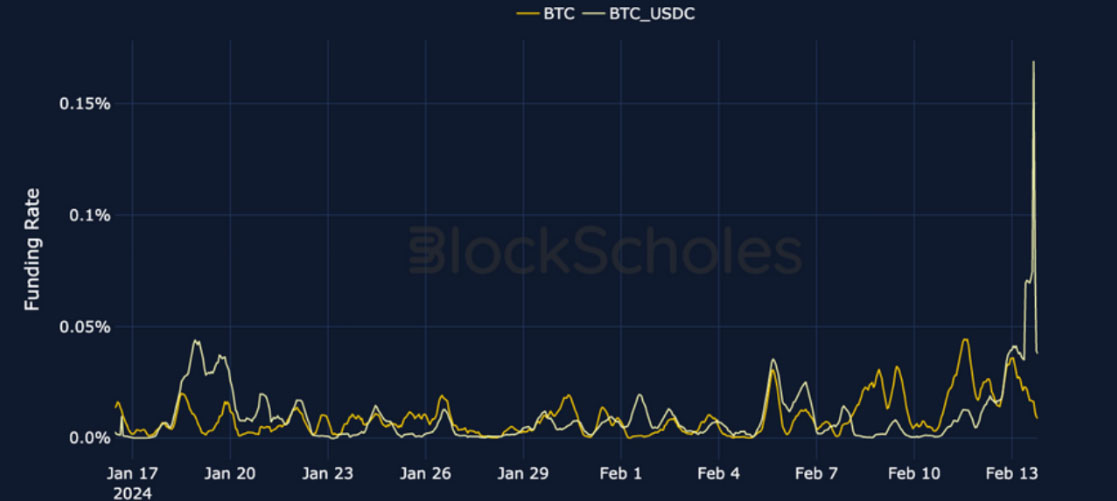
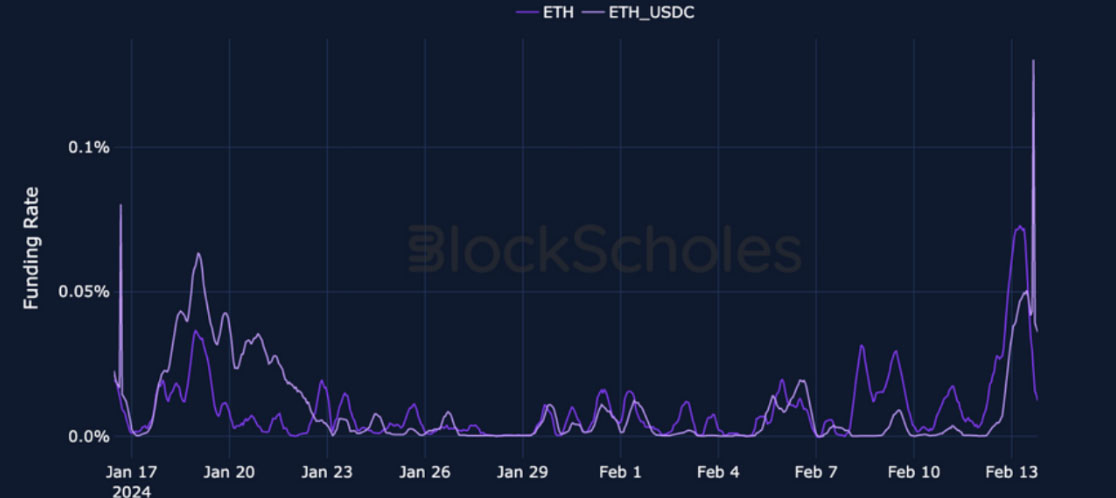
Perpetual Swap Funding Rate
BTC FUNDING RATE – funding rates have spiked to their highest levels since December last year during the rally in spot to levels above $50K.
ETH FUNDING RATE – has climbed at a sharper pace to levels similar to BTC’s, indicating continued and strong demand for long exposure.
BTC Options

BTC SABR ATM IMPLIED VOLATILITY – has increased consistently over the last week to trade at its highest levels in over a month.
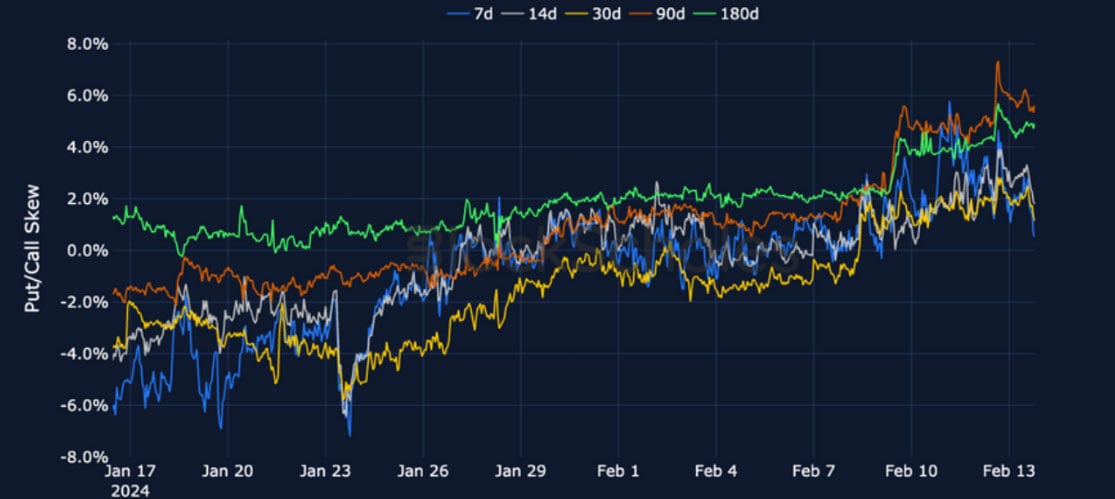
BTC 25-Delta Risk Reversal – has followed vol in its trend upward, showing that the strong demand for optionality is expressing a bullish view.
ETH Options

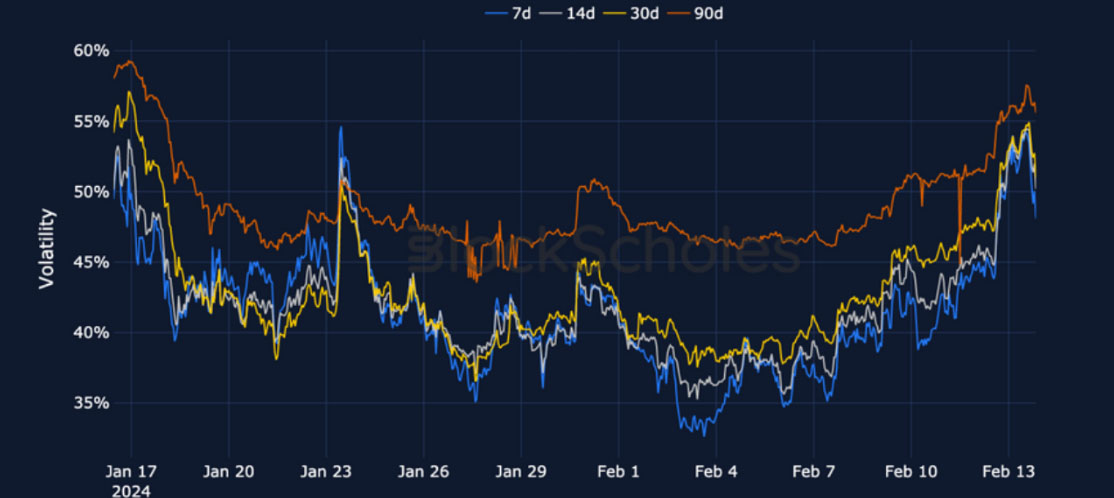
ETH SABR ATM IMPLIED VOLATILITY – trades at the top of its monthly range after climbing consistently over the last week alongside BTC’s.
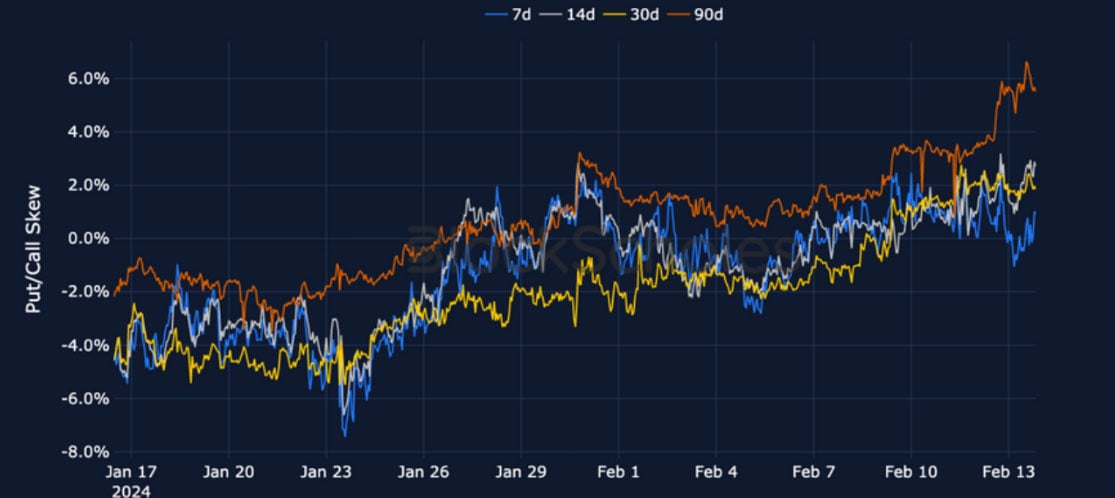
ETH 25-Delta Risk Reversal – shows strong demand for upside participation, with a stronger tilt towards OTM calls in 90D tenor smiles.
Volatility Surface
BTC IMPLIED VOL SURFACE – has seen volatility increase across the whole surface, with short-to-mid-dated OTM calls rising the most.
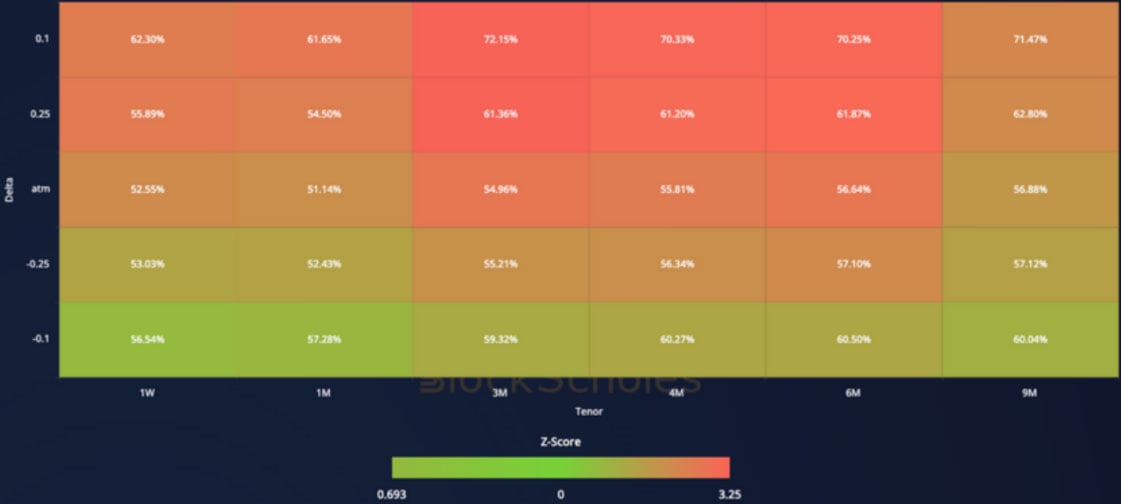
ETH IMPLIED VOL SURFACE – mirrors BTC’s rise across the surface, but at a less pronounced rate relative to its recent history.
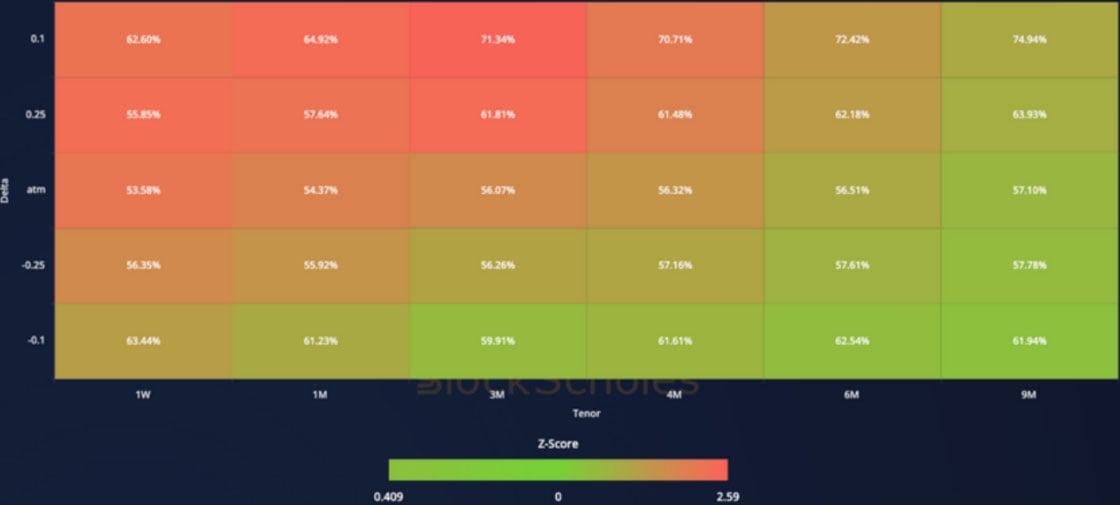
Z-Score calculated with respect to the distribution of implied volatility of an option at a given delta and tenor over the previous 30-days of hourly data, timestamp 10:00 UTC, SABR smile calibration.
Volatility Smiles
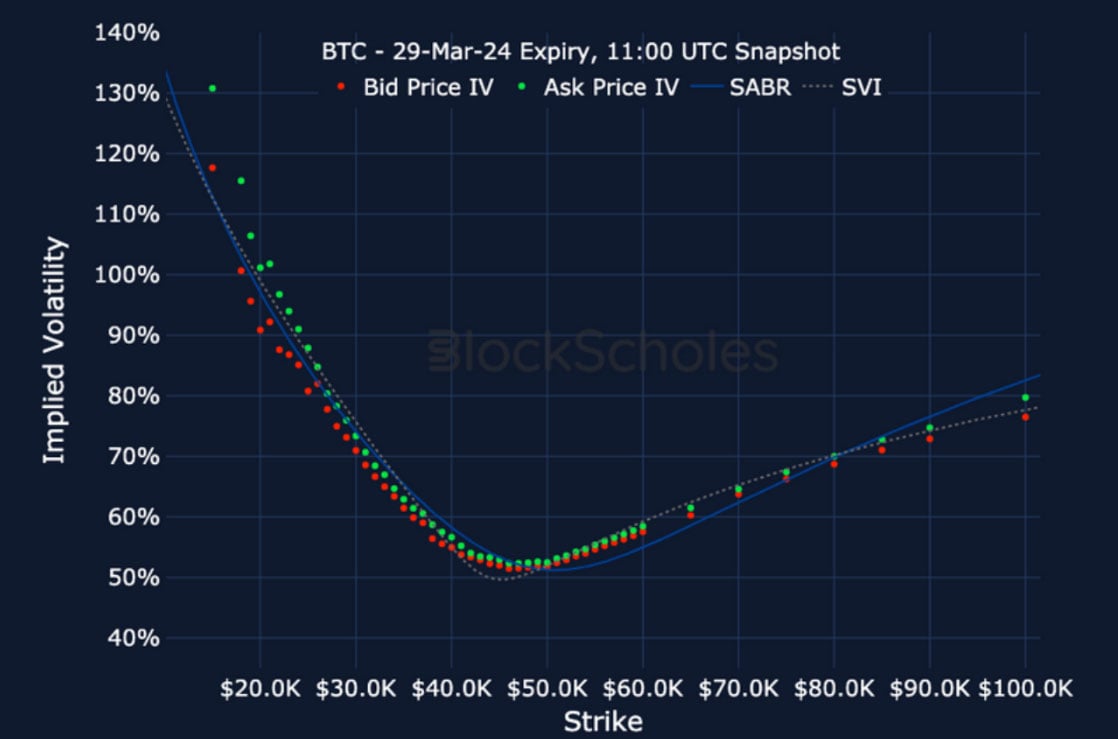
BTC SMILE CALIBRATIONS – 29-Mar-2024 Expiry, 11:00 UTC Snapshot.
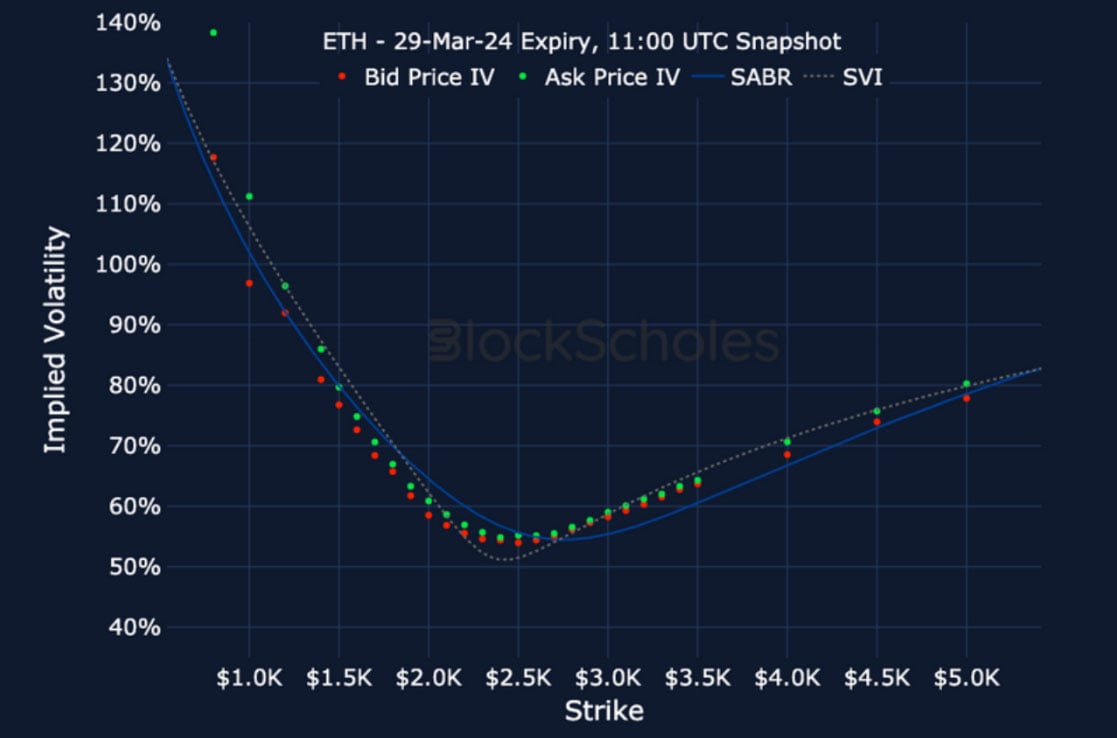
ETH SMILE CALIBRATIONS – 29-Mar-2024 Expiry, 11:00 UTC Snapshot.
Historical SABR Volatility Smiles
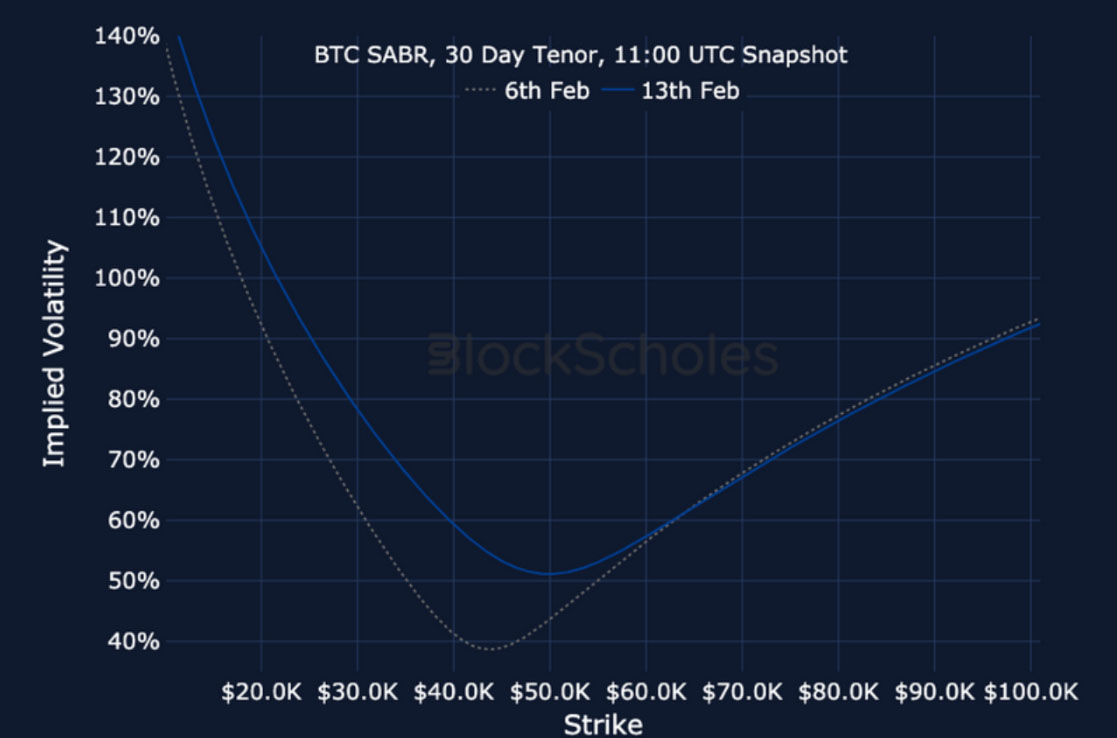
BTC SABR CALIBRATION – 30 Day Tenor, 11:00 UTC Snapshot.
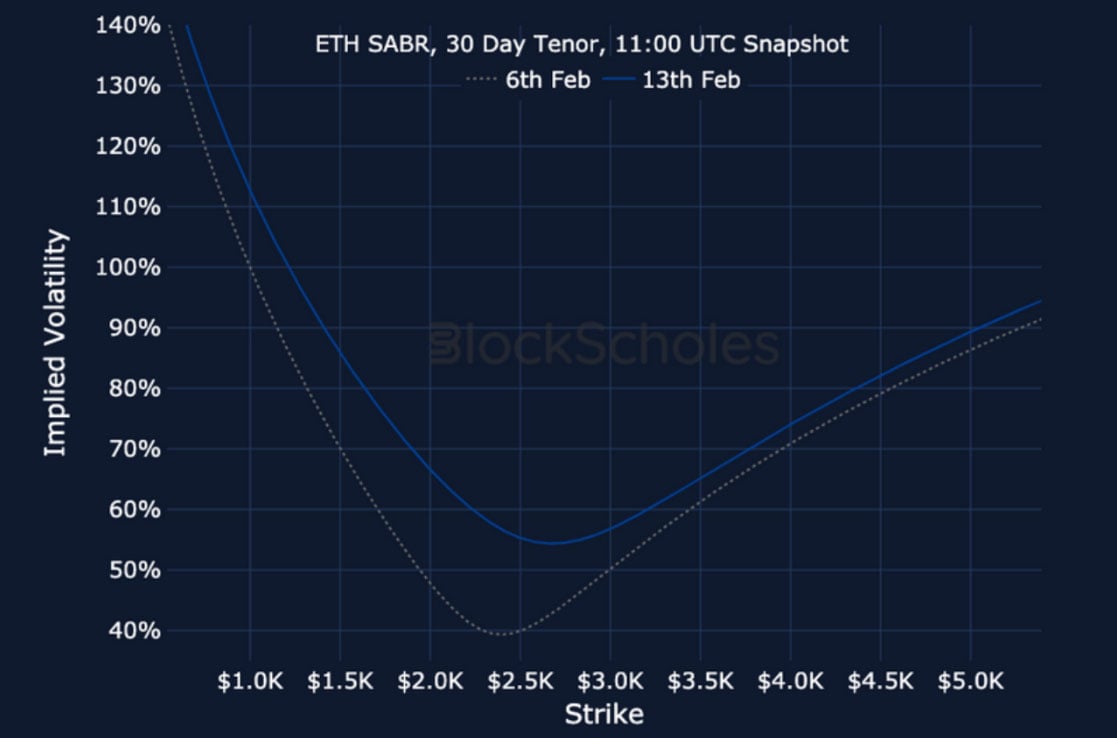
ETH SABR CALIBRATION – 30 Day Tenor, 11:00 UTC Snapshot.
AUTHOR(S)
