
The new bull market is likely to come later, and compared to the previous bull market, the new bull market may be more moderate. It is difficult for the crypto market to experience “tachycardia” (high volatility) similar to that in 2021, but it will also return to a relatively normal level of volatility.
Gradually Disappearing “Market Heartbeat”
Singapore is still hot in September. Token 2049 has attracted worldwide participants from the crypto market, and various meetings and gatherings are full of schedules, making it overwhelming. It seems that the recovery of the crypto market is within reach.
However, the crypto market itself does not think so. From the market cap perspective, after experiencing the decline in August, the total market cap of the crypto market has been steadily fluctuating around $1T. Mainstream crypto assets such as BTC and ETH have also performed poorly. The price of BTC is getting farther and farther away from the “old ceiling” near $30k, while ETH continues to struggle near $1.6k.
In addition, the intraday volatility of BTC and ETH was even less than 0.1% at one point; the “heartbeat” of the crypto market seems to have stopped. Although with the return of macro uncertainty, the crypto market seems to have some fluctuations, it is clear that the volatility level in mid-September is still at a relatively low level since 2023 for both BTC and ETH.
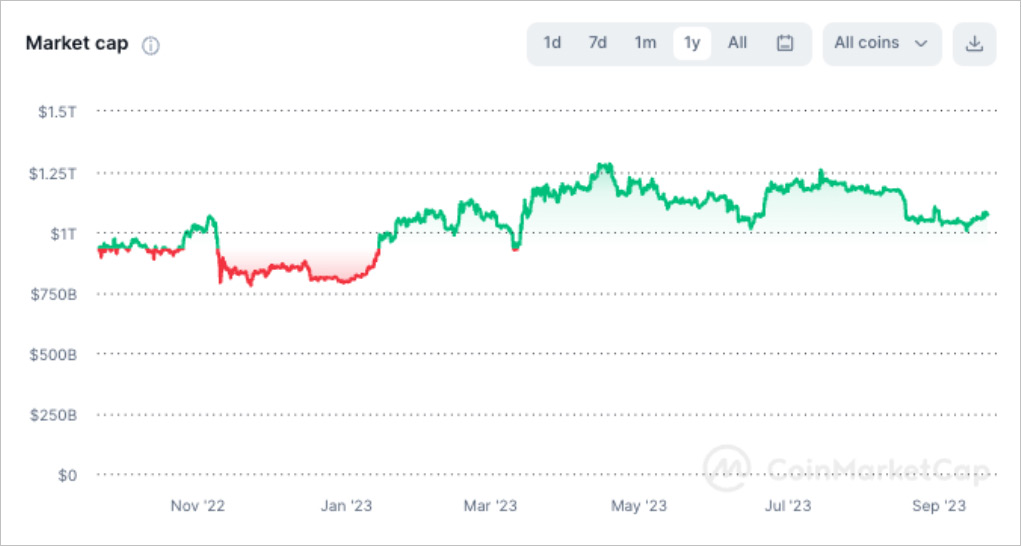
Changes in the total market cap of the crypto market in the past year, as of September 20, 2023. Source: Coinmarketcap
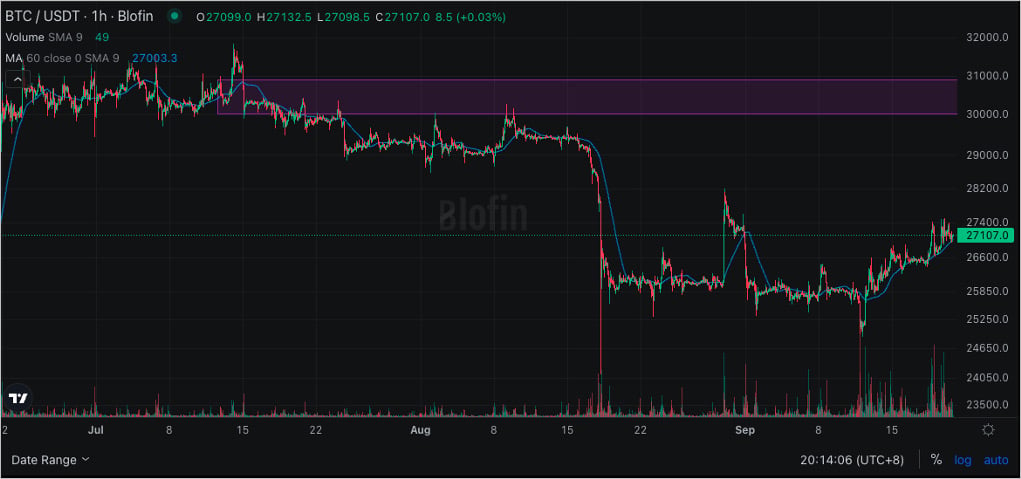
Price change of BTC from July, as of September 20, 2023. Source: blofin.com
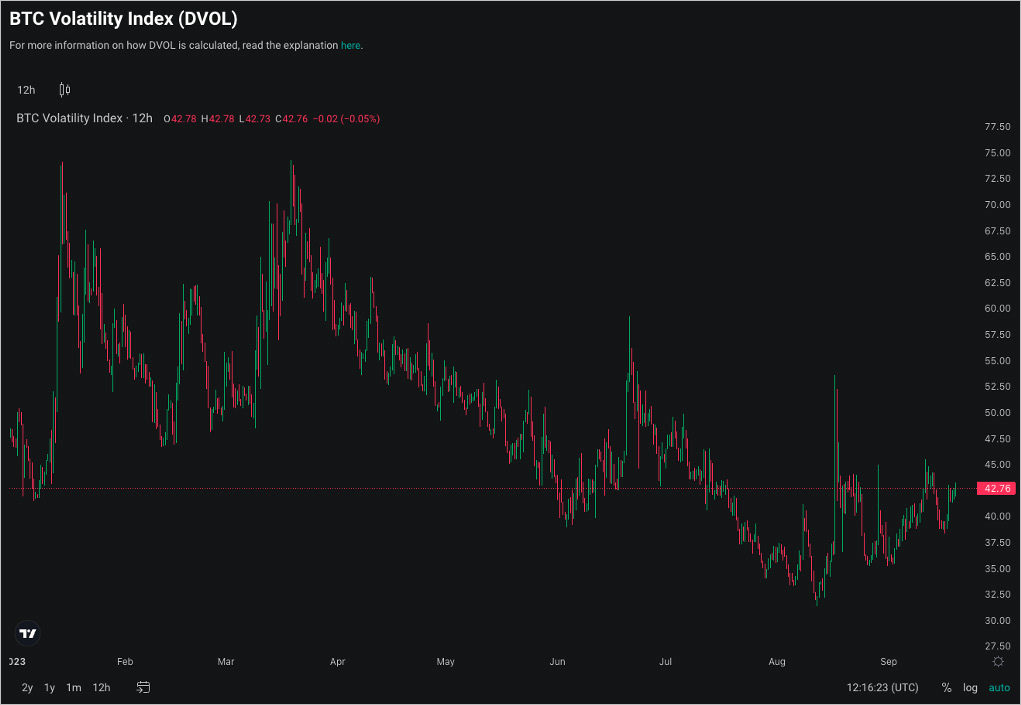
YTD BTC Volatility Index (DVOL) changes, as of September 20, 2023. Source: deribit.com
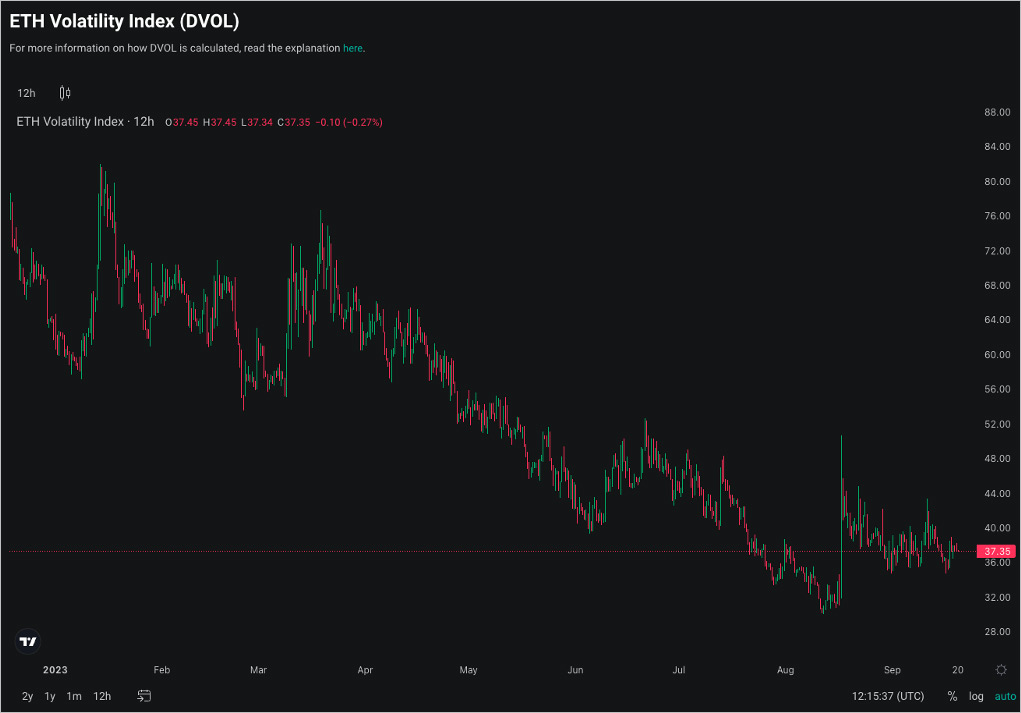
YTD ETH Volatility Index (DVOL) changes, as of September 20, 2023. Source: deribit.com
Interestingly, similar situations do not only exist in the crypto market. Suppose we include volatility in our observation range and consider risky asset markets from a volatility perspective. In that case, a surprising conclusion emerges: the volatility of all risky asset markets is slowing down.
The VIX volatility index is still close to its lowest level since the outbreak of Covid-19 in early 2020. The BofA MOVE Index, an indicator of volatility expectations in the US bond market, is close to its lowest level since February. The JPM G7 volatility index, a measure of expected FX volatility in the next 3 months, has fallen to its lowest level since June. The volatility indicators of gold and oil are also close to their lows for the year. What happened?
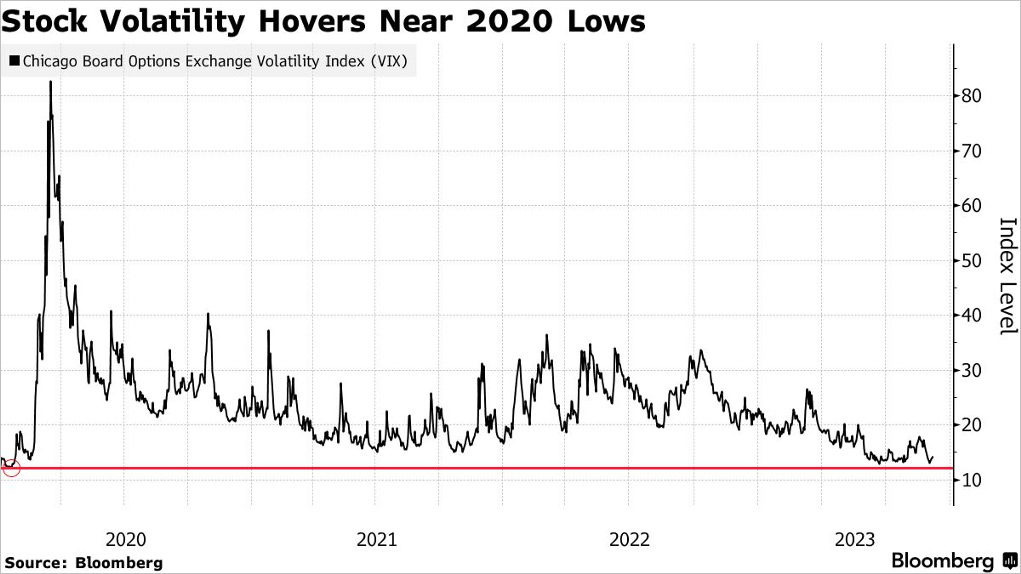
Changes in the VIX index from 2020. Source: Bloomberg
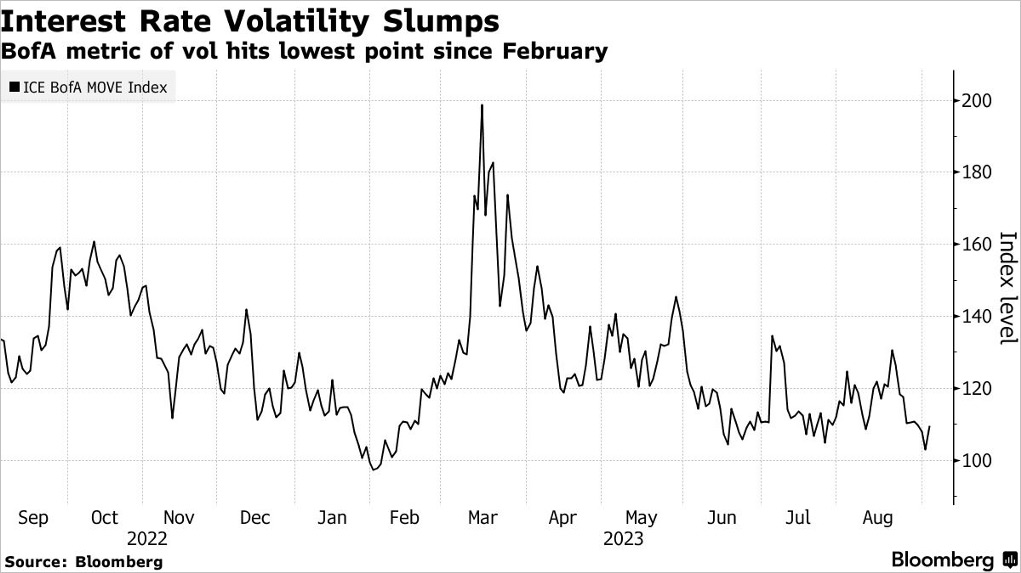
Changes in the ICE BofA MOVE index. Source: Bloomberg
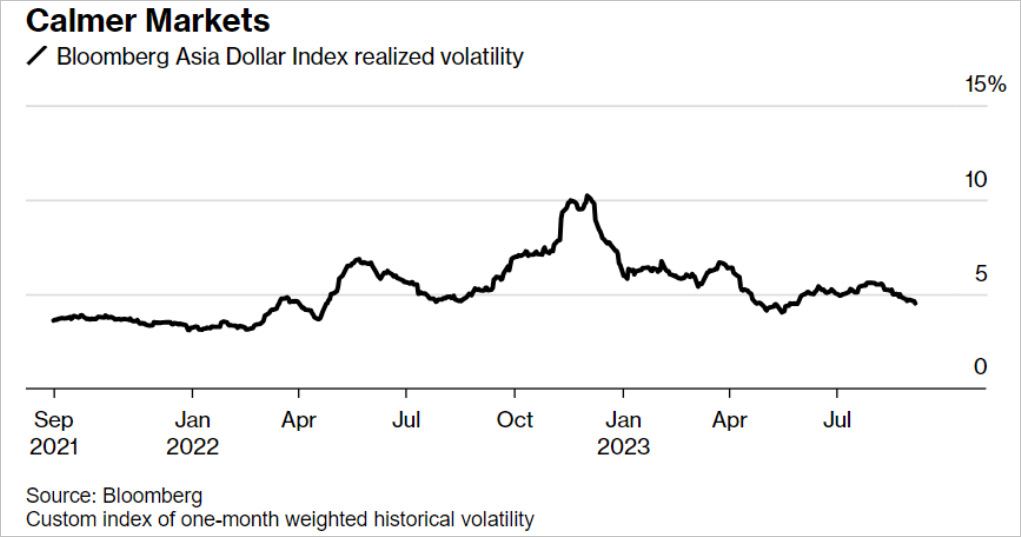
Changes in the Bloomberg Asia Dollar index. Source: Bloomberg
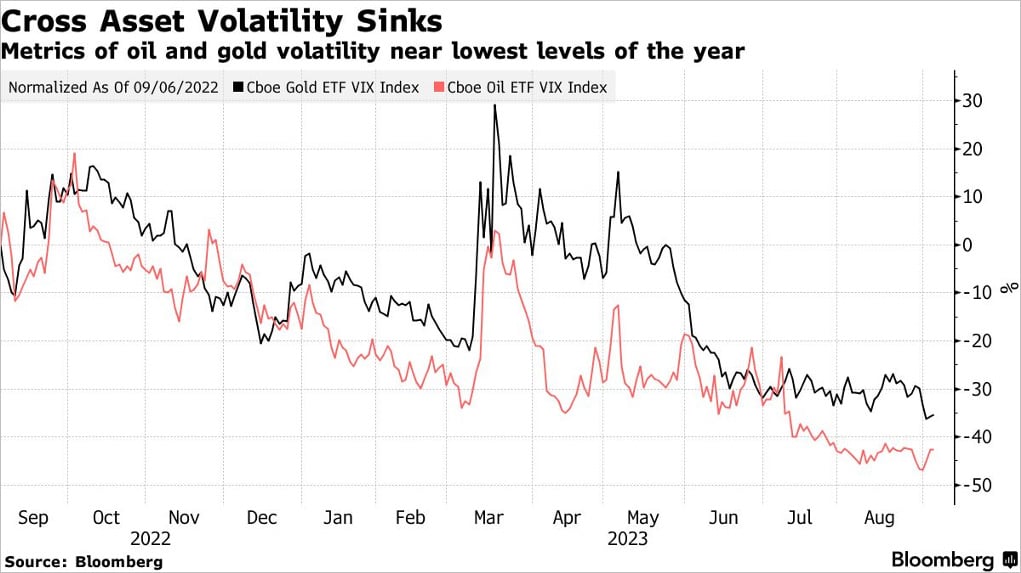
Changes in gold and crude oil ETF VIX indices. Source: Bloomberg
Generally speaking, the lack of cash liquidity is one of the essential reasons for low volatility. For ease of understanding, let’s simply divide the investors into “asset holders” and “cash holders.” “Asset holders” hope to sell their stocks, gold, and Bitcoin at a good price, while “cash holders” hope to buy assets at a reasonable price and profit from asset appreciation or volatility in the future.
- At a time when cash liquidity is sufficient, as there is more cash in the market, it is easier for asset holders to sell assets for profit. The appreciation of asset prices also stimulates cash holders to buy assets to gain returns or higher expected returns. Frequent trading by investors has driven up market volatility.
- At a time when cash liquidity is limited, cash holders hope to acquire assets at a lower price to obtain ideal expected returns. However, asset holders often lose money by selling at this time, so they tend to hold positions and wait rather than sell. This means that the price difference widens and liquidity decreases. At the same time, in the absence of uncertainty, investors usually lack the motivation to trade. As more and more investors adopt a wait-and-see attitude, market volatility gradually decreases.
- At the same time, in the case of limited liquidity, investors usually allocate liquidity to assets with higher potential returns, such as technology stocks and T-bills, and adopt a wait-and-see attitude in the crypto market, which leads to a significant decline in trading volume. At the same time, due to the influence of positive gamma, hedging trading occupies a relatively dominant position, which further reduces volatility, makes it difficult to form trends, and drives investors to wait and see, creating a cycle, ultimately leading to the market’s heartbeat “almost stopping”.
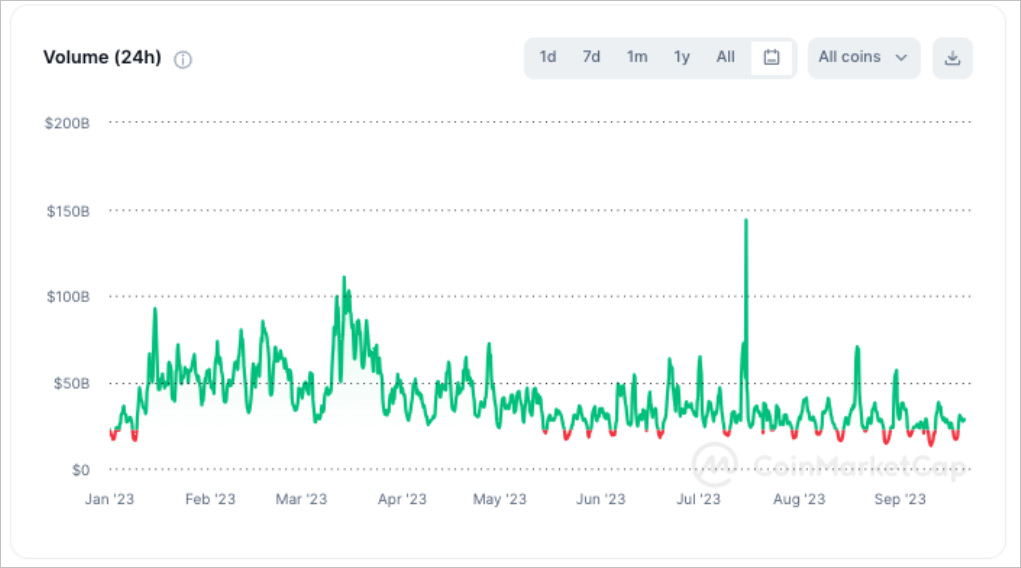
YTD daily trading volume changes in the crypto spot market, source: Coinmarketcap
So, where did the cash liquidity go? Let’s turn to the bond and money fund markets, where we may have the answers we want.
5 Percentage
In 2021, when the crypto market and US stocks were “close to crazy,” holding cash was a “puzzling” behavior: interest rates close to 0% and record-high inflation made cash holders unprofitable. But just two years later, everything changed; under the command of Powell and Lagarde, the federal funds rate rose to 5.25%, while the European Central Bank’s interest rate reached the highest level since the birth of the euro to recover the overflowing liquidity on the market and “suppress inflation.”
The premise for investors to be willing to hold cash is a sufficiently high risk-free return. With interest rates above 5%, banks have begun to offer time deposits with an annualized interest rate of 5%. Even if calculated based on the actual risk-free interest rate after removing the impact of inflation, the annualized return that time deposits can provide is close to 2% – enough to make many people choose to hold cash.
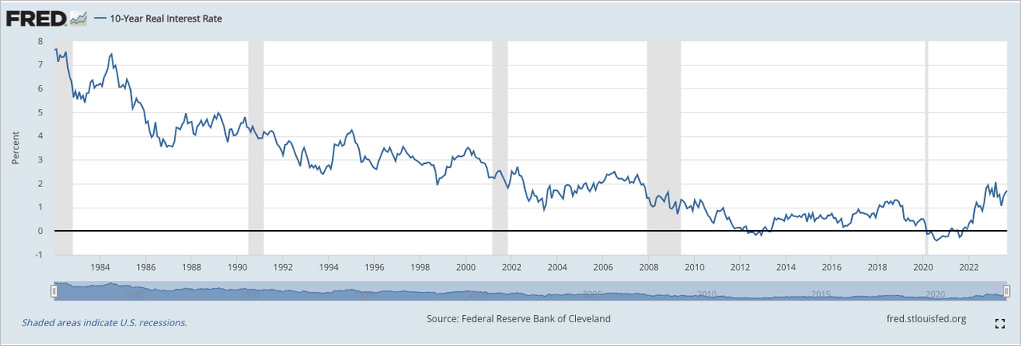
Changes in the 10-year real interest rate. Source: Fed of Cleveland
Compared with other major asset classes, a risk-free return of 5% is rare in history. Since 2001, the 12-month rolling earnings yield of the S&P 500 has only exceeded 5% about 30% of the time, and it is not risk-free. With the continuous rise of cash returns, the performance of cash has even surpassed that of the S&P 500. The liquidity trend can already be imagined when investors can obtain higher returns than stock portfolios without risk.
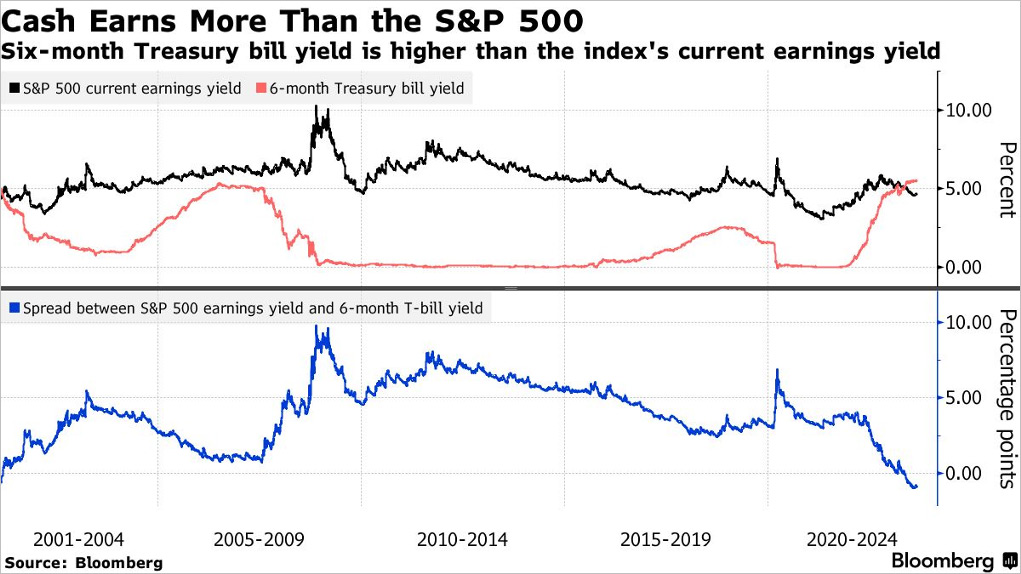
S&P 500 earnings yield changes compared to 6-month T-bills yields, source: Bloomberg
For the crypto market, cash seems to show more potent attractiveness. After experiencing the “optimistic period” in July, in mid-September, the 1-year implied forward rate of BTC and ETH gradually fell to around 4.5% and 3.3%, respectively. In contrast, even with the 10-year T-notes yield (4.34%) as the risk-free yield standard, the gap between BTC’s 1-year implied forward rate and the risk-free rate has narrowed to within 25 bps, while ETH’s 1-year implied forward rate has significantly lagged behind the risk-free rate.
It is worth noting that if the fixed deposit interest rate and the 2-year T-notes yield are used as comparison underlines, the expected return performance of BTC and ETH becomes “pale” in the face of a risk-free yield of 5%. Of course, do not forget the latent risk of cryptos; investing in the money market seems to have become a more rational choice. Investors will reduce their exposure to assets with annualized returns below 5%.
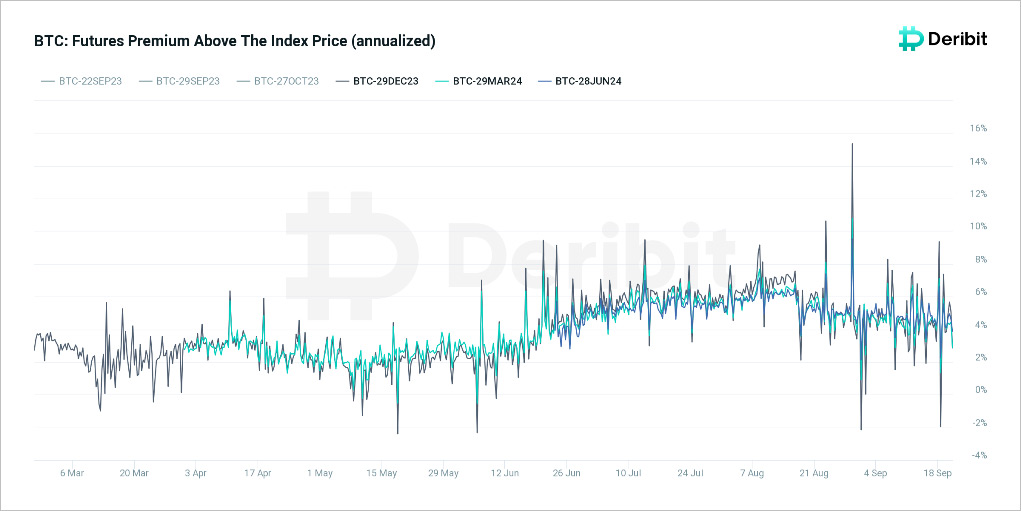
BTC futures annualized premium changes, as of September 21, 2023. Source: Deribit Metrics
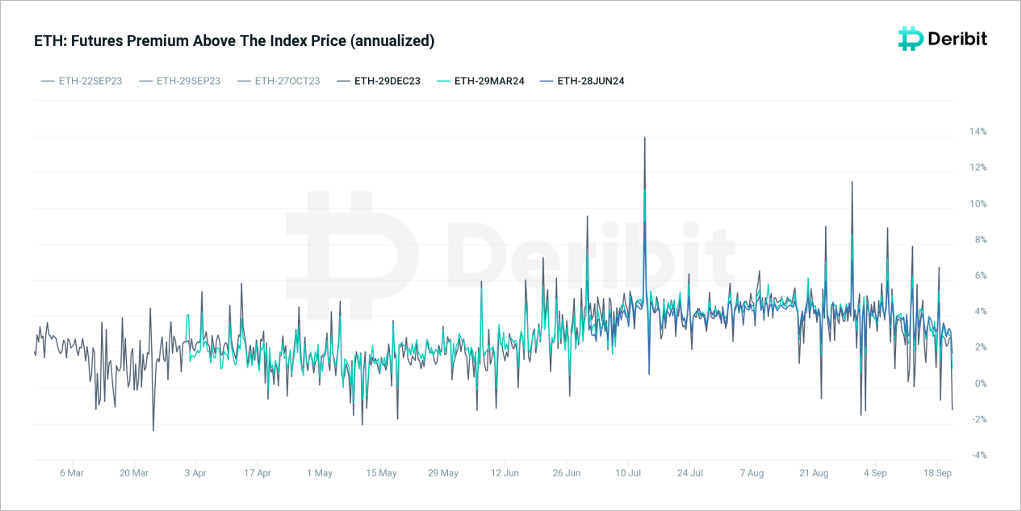
ETH futures annualized premium changes, as of September 21, 2023. Source: Deribit Metrics
The behavior of institutional investors is even more intriguing. Looking back at the weekly crypto asset flow from the beginning of 2023 to the present, it is not difficult to find that the behavior of institutional investors has a significant “tidal” feature: when the crypto market has a sharp rise, institutional funds pour in, and when the market tends to be calm, institutional funds begin to flow out.
Strong demand for cash and government bonds is sweeping the market. Even retail investors have joined the “treasury bond trading club.” In just one year, the size of 6-month T-bills bid by retail investors has reached nearly $2.90B, a new high since 2001. Compared with the demand level before the interest rate hike, retail investors’ demand for short-term government bonds has increased more than fivefold. Money market funds have also got a new round of capital inflows. In the first week of September alone, investors injected over $57B into global money market funds, a 3-month high.
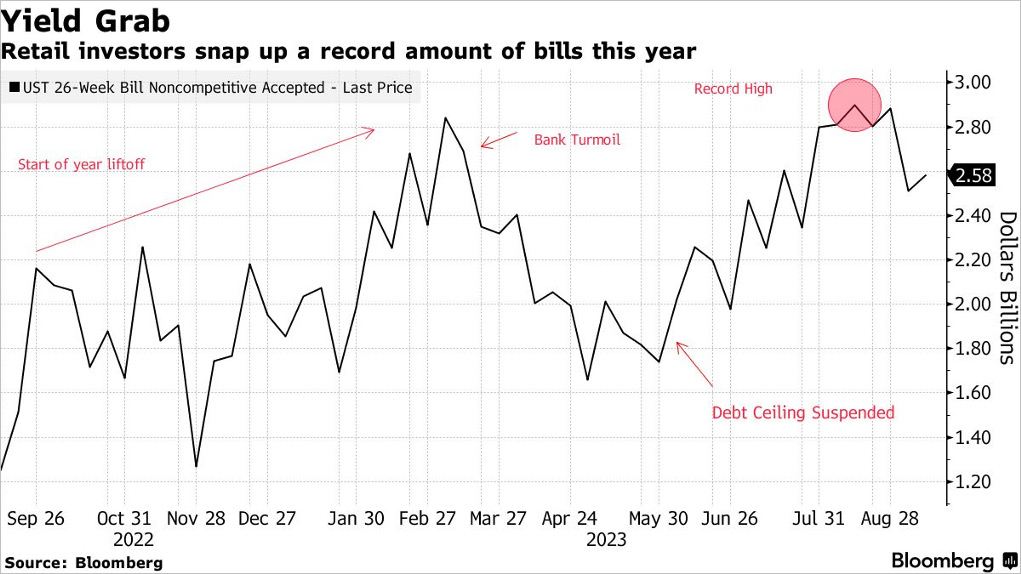
Changes in demand for US short-term T-bills by retail investors, as of August 2023. Source; Bloomberg
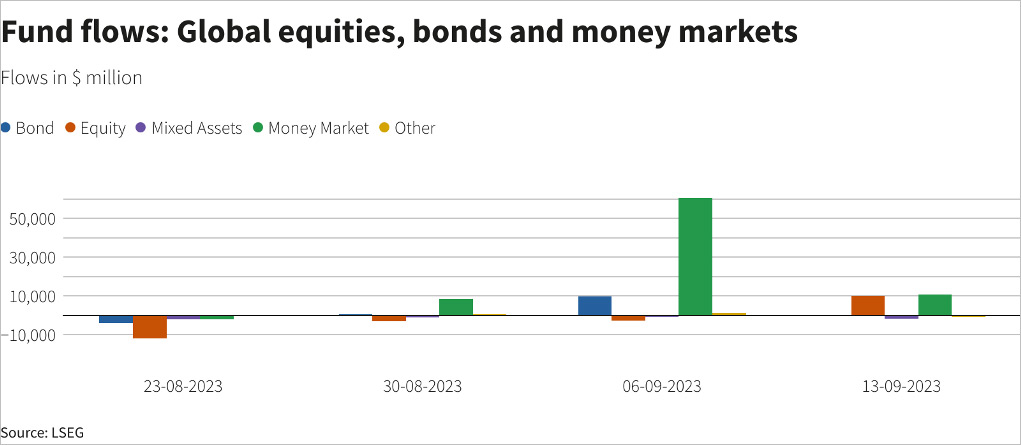
Changes in net inflows/outflows of different types of funds, as of September 2023. Source: Reuters
In contrast to the above situation, the cash liquidity scale is still slowly shrinking in the crypto market. Since the beginning of 2023, the net outflow of cash liquidity in the crypto market has exceeded $13B, and the total cash liquidity scale has shrunk to around $120B. In addition, liquidity continues to flow out of exchange-traded products (ETPs), with a total net outflow of $500M in the past two months.
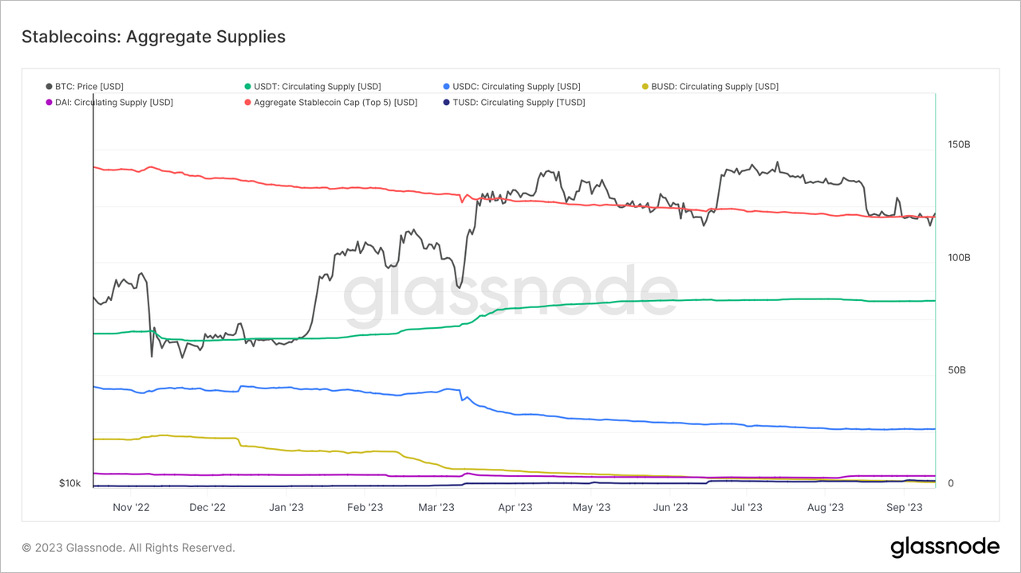
YTD changes in aggregate supplies of cash liquidity in the crypto market, as of September 20, 2023. Source: Glassnode
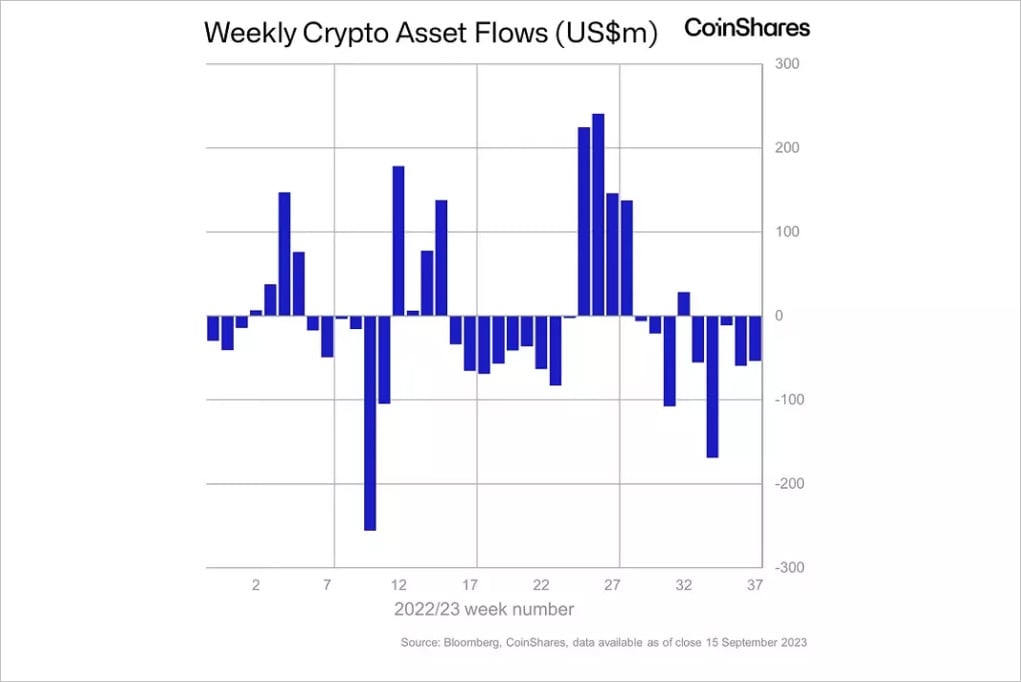
Weekly net inflow/outflow from crypto funds, as of September 20, 2023. Source: CoinShares
Although the net outflow of cash liquidity has stopped since mid-August, there are no apparent signs of liquidity return. As the implied forward rate of mainstream crypto assets continues to be below 5%, the cash liquidity scale supporting the crypto market cap may remain around $120B in the short to medium term. The above means that, due to insufficient cash liquidity, any upward trend may be difficult to sustain for a long time.
Oil and “Sticky Inflation”
The return of liquidity is a prerequisite for the return of the crypto bull market, and the decline in interest rates is a prerequisite for the return of liquidity. Therefore, the level of interest rates can be said to be the “lifeline” of the crypto market. However, the Fed and the ECB have repeatedly stated that they will not lower interest rates until inflation reaches the target range. So, let’s take a look at the current US inflation level:
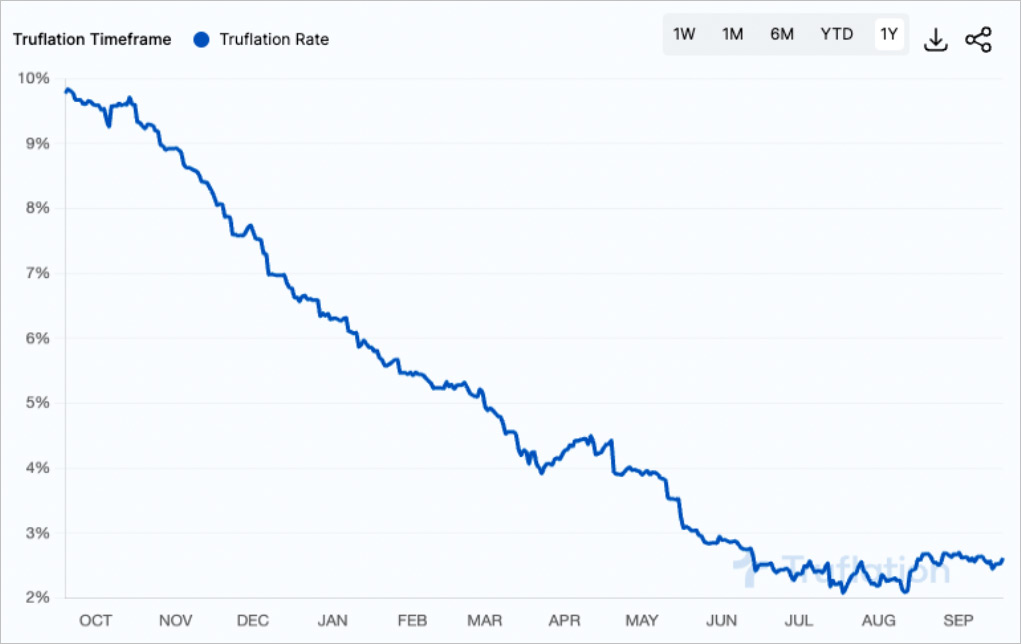
US real-time inflation changes as of September 20, 2023. Source: Trueflation.com
Yes, after more than one year of interest rate hikes, we are only “one step away” from the 2% inflation target. However, since August, inflation has rebounded; the risk of reflation is gradually emerging. So, where do the “culprits” of reflation come from? Breaking down the inflation data by sector, it is not difficult to find that housing and transportation are the core factors of this inflation rebound.
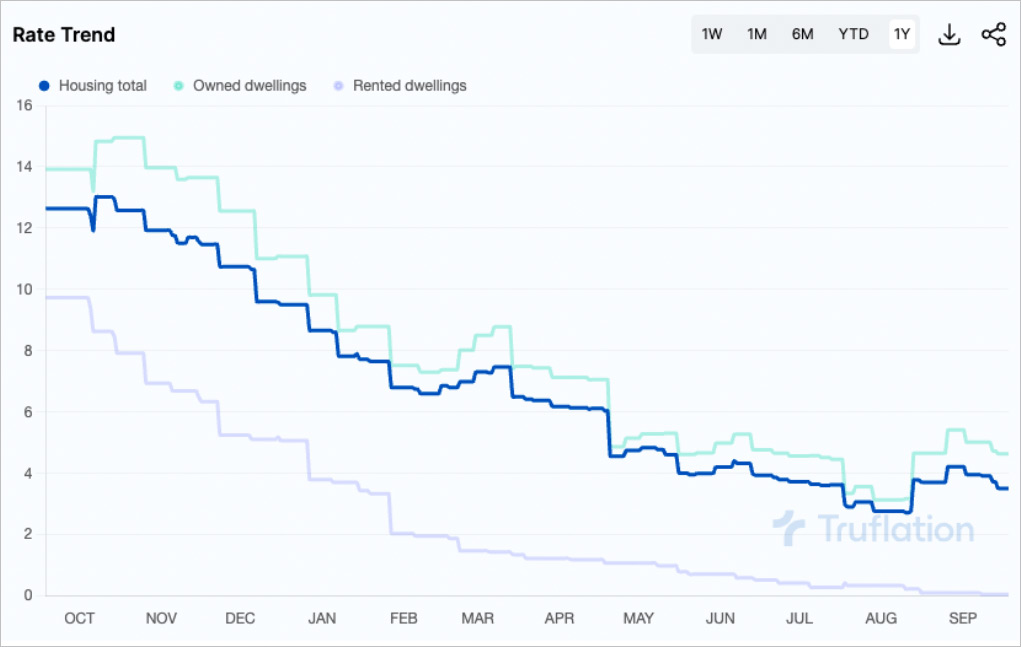
US real-time inflation (housing sector) as of September 20, 2023. Source: Trueflation.com
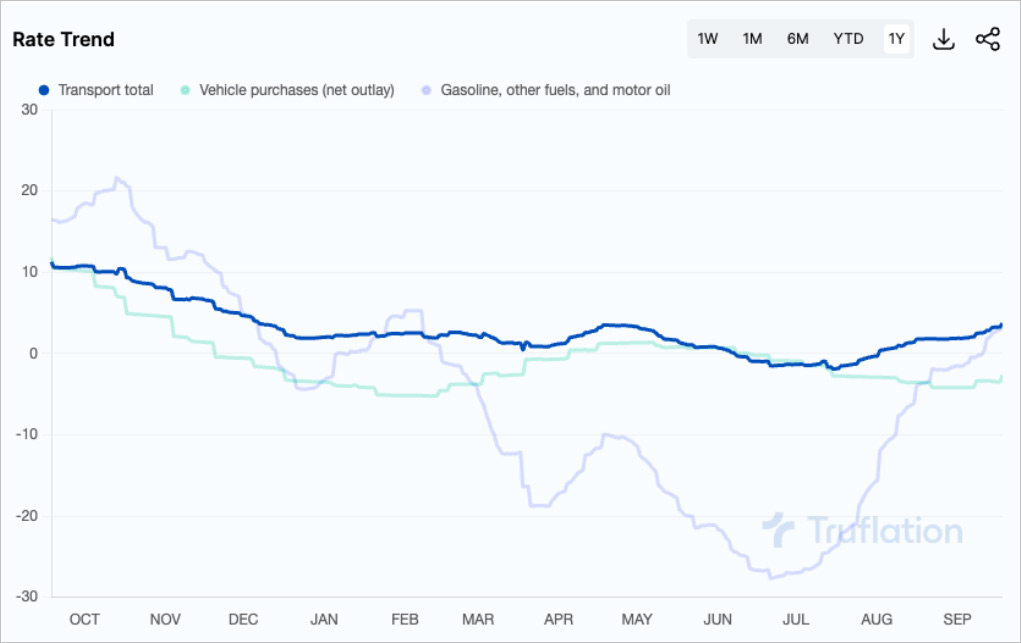
US real-time inflation (transportation sector) as of September 20, 2023. Source: Trueflation.com
That is the problem. Housing and transportation belong to the “necessities of life” category, and transport is even more critical. In the US, people can choose not to buy or even rent a house but cannot choose not to drive. Therefore, the demand for oil products is “long-term and continuous,” which means that changes in oil prices will significantly affect inflation and even play a decisive role in achieving the inflation target at some point – as is currently the case.
Starting from July 2023, affected by the production cuts of major OPEC oil-producing countries, the oil price steadily rose and broke through $90 in mid-September. The prices of gasoline and diesel also soared. In the US, diesel and gasoline prices hit the second-highest level in history after mid-2008 and mid-2022. At the same time, OPEC expects that the demand gap for crude oil will continue to widen in 2023q4, which means that the possibility of a significant decline in oil prices in the fourth quarter is relatively small.
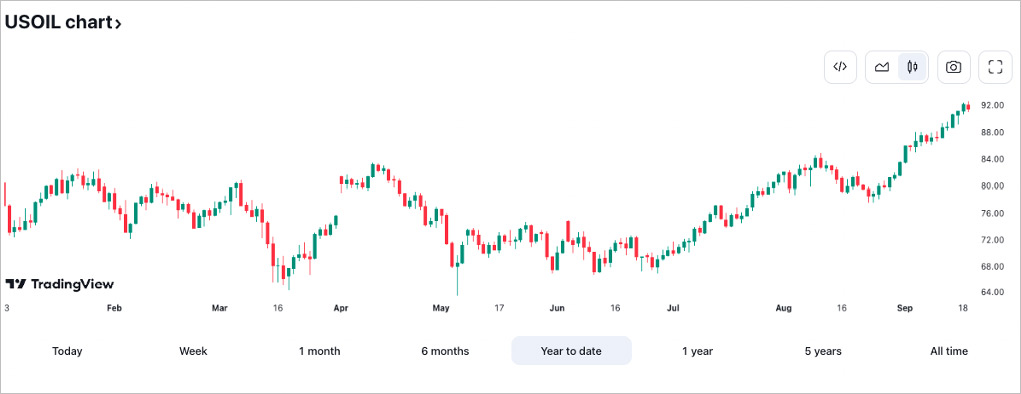
YTD Changes in crude oil prices, as of September 18, 2023. Source: TradingView
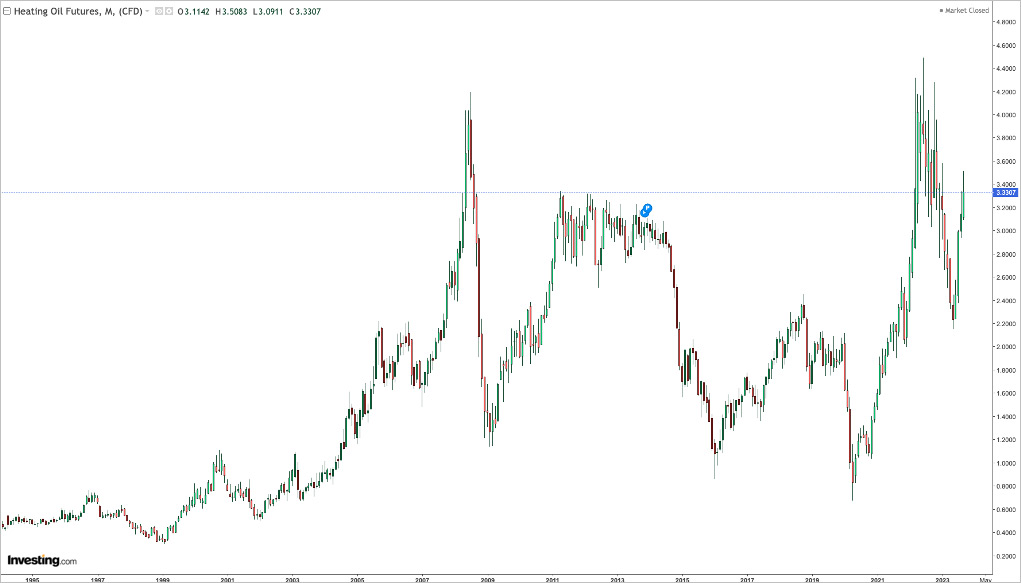
Heating oil futures prices changes, as of September 18, 2023. Source: Investing.com
For the US, the tools available on the supply side seem insufficient to cope with high oil prices. The weekly ending stocks of crude oil in SPR have fallen to the lowest level since 1984, and the high refining profits brought by high oil prices make energy companies more willing to pay high prices for crude oil and ultimately pass on the rising prices to consumers, thereby pushing up inflation.
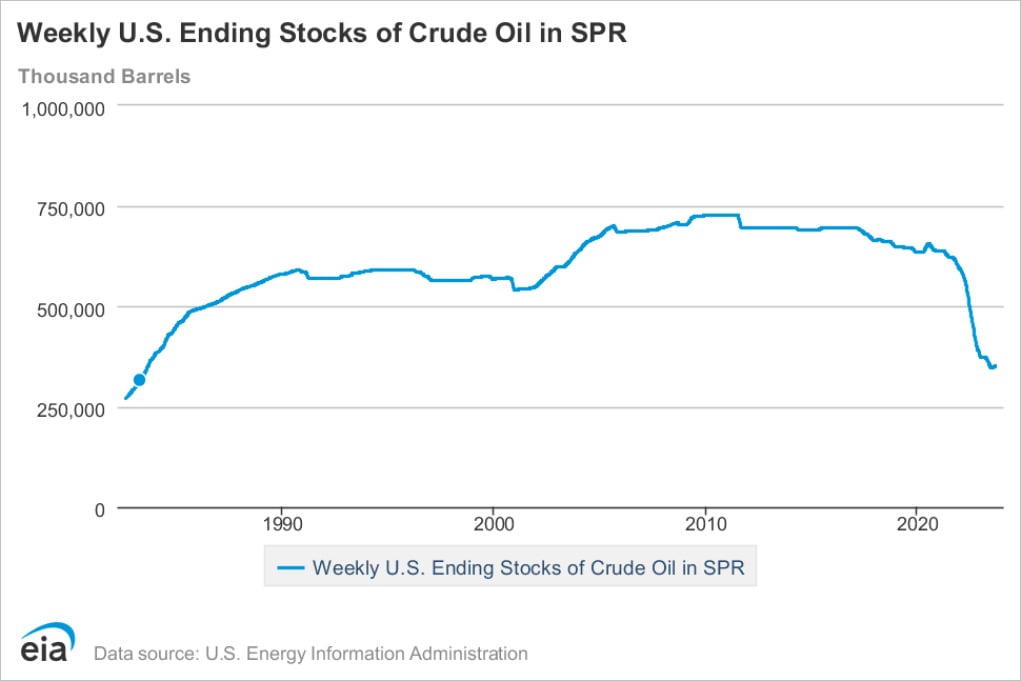
Changes in the US SPR. Source: US Energy Information Administration (EIA)
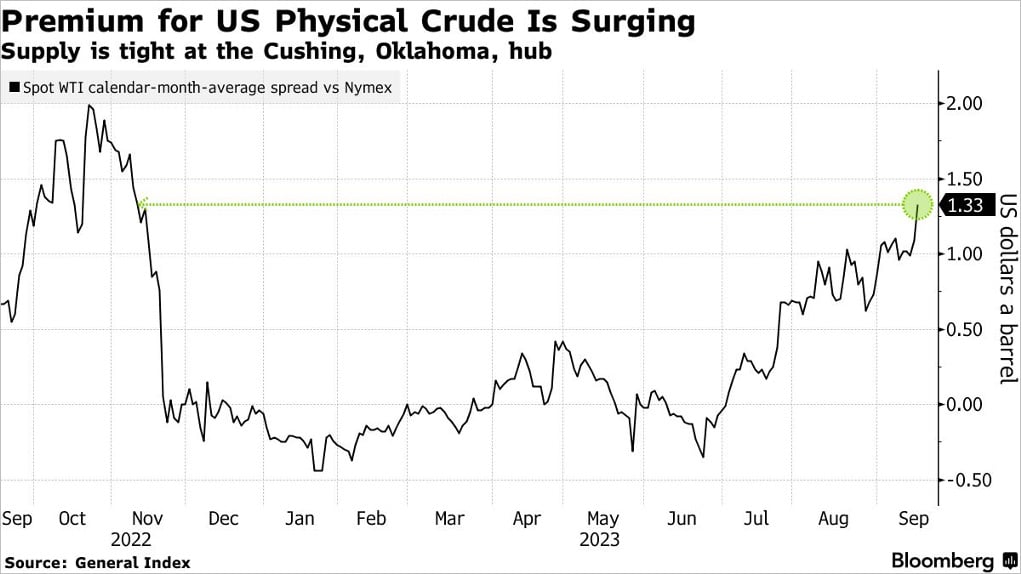
Changes in the spread between WTI crude oil spots and futures, as of September 2023. Source: Bloomberg
In response to the rebound in inflation from essential goods, the Fed can only choose to suppress demand when it is difficult to expand supply in the short term. This means longer-term high interest rates or even more rate hikes until inflation reaches the target level. Investors have priced in a longer-term interest rate peak in the interest rate market. They believe interest rates above 5.25% will continue until at least June 2024, even longer. It seems that the “liquidity ceiling” is still difficult to shake. Worse still, news from Europe and Japan indicates that the possibility of further sinking of the ceiling is not zero.
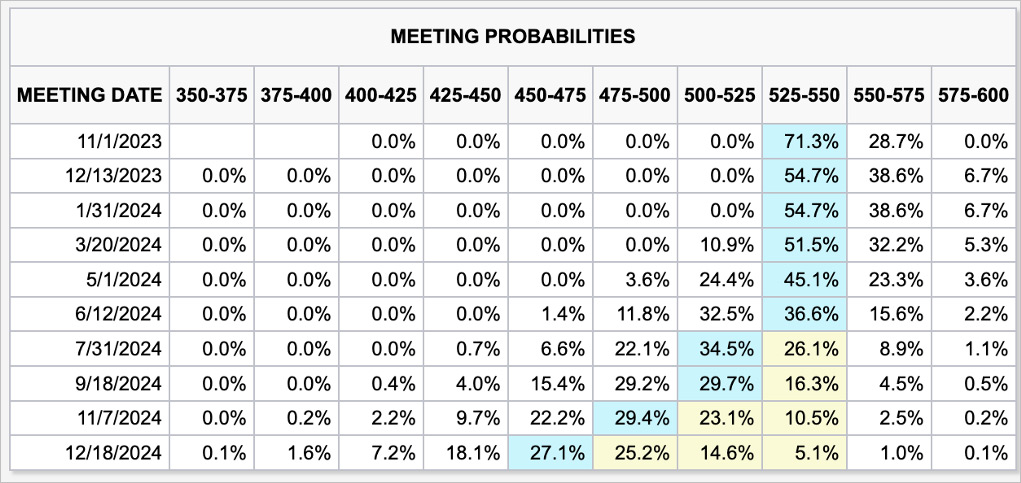
The expected path of changes in the federal funds rate, as of September 21, 2023. Source: CME Group
Europe and Japan: Same Choice With Different Backgrounds
For the ECB, Europe’s inflation situation seems to be more severe. Like the Fed, the ECB has also set a target of reducing inflation to 2%. However, after one year of interest rate hikes, although the base rate has been raised to the highest point since the emergence of the euro, the effect is limited: the inflation level in Europe is still above 6%. In addition, oil prices also play an important role in European inflation.
Lagarde has no choice; “further liquidity contraction” is one of the few options. To address the problem of excess liquidity, the ECB has prepared to raise the reserve requirement ratio for banks, and some other measures (such as stopping bond purchases and setting a new interest rate guidance framework) are also under consideration, which will further absorb the remaining liquidity in the risk asset market.
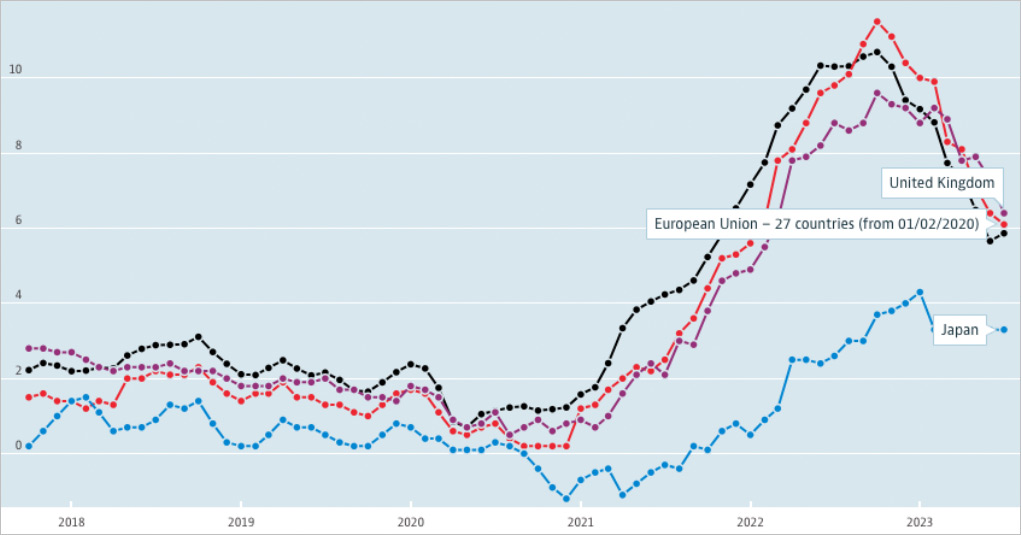
Comparison of CPI data changes in the Eurozone, UK, and Japan, as of September 2023. Source: OECD
As one of the main sources of liquidity in the risk asset market, the Bank of Japan (BOJ) is finally ready to take action in the face of the rebound in inflation and the yen depreciation. Interest rate hikes are already under consideration, and control over the JPY exchange rate is also planned. For ” Mrs. Watanabes,” once the BOJ turns hawkish, the appreciating yen will push them to sell risk assets to repay debt based on the JPY margin.
Although the ECB and the BOJ face different macro environments, their policies may tend to be consistent under the common goal of “curbing inflation.” The above situation makes obtaining liquidity more difficult for the crypto market. With the addition of the BOJ, the liquidity shortage situation may continue and become long-term; cheap liquidity is already in the “past tense.”
Cardiopulmonary Resuscitation
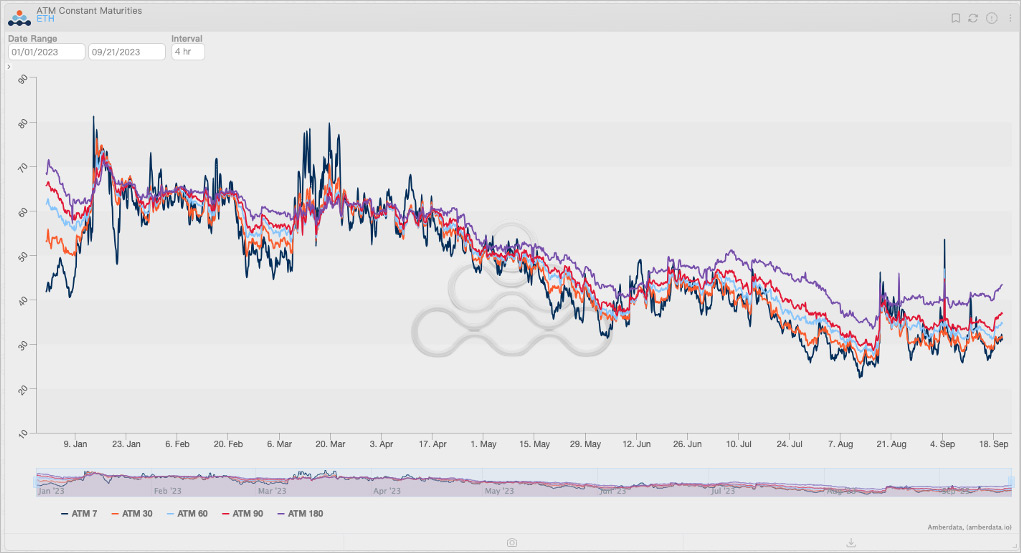
Overall, the low volatility of the cryptocurrency market seems difficult to change in the short term, and investors’ expectations for high volatility have nearly disappeared. Even with the FOMC meeting, the implied volatility of investor pricing in the derivatives market is still relatively low, and there is no relevant expectation for possible short-term volatility.
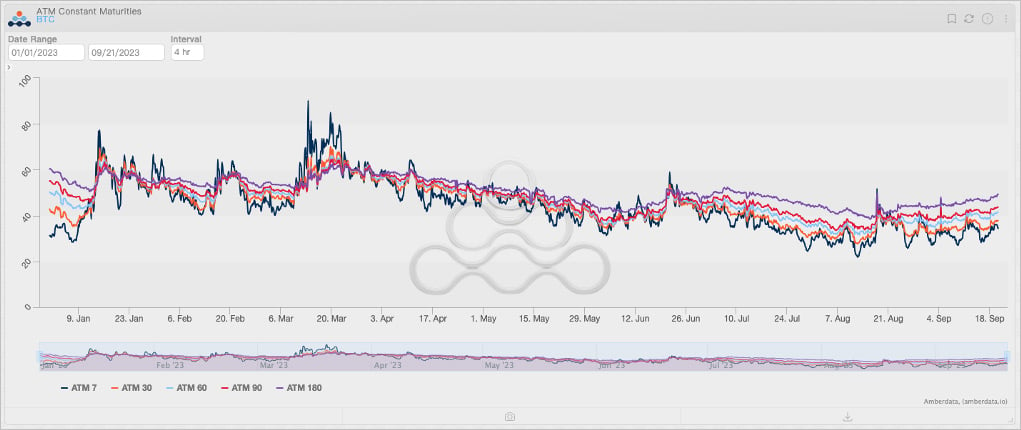
BTC ATM implied volatility change from early 2023 to the present, source: Amberdata Derivatives
ETH ATM implied volatility change from early 2023 to the present, source: Amberdata Derivatives.
Obviously, only the return of liquidity can drive the crypto market to “recover its heartbeat.” From a macro perspective, the return of liquidity needs to meet at least the following conditions:
- Oil production cuts stopped, and long-term high interest rates ultimately suppressed oil demand, eventually causing inflation to fall to the target range.
- Spot BTC and ETH ETFs and other new narratives attract liquidity to return.
- The expectation changes have led to the expected return level of BTC and ETH significantly exceeding the risk-free yield, which will occur when oil prices fall and inflation falls, ultimately triggering the formation of interest rate cut expectations.
However, it is unlikely that all of the above conditions will be met in the next year.
- The duration of OPEC’s oil production reduction measures has been extended. Even at the end of 2023 or the beginning of 2024, the oil production reduction will not stop, and the subsequent impact of the oil production reduction may continue in 2024q1. The above means that the Fed and the ECB must adopt sustained high interest rates due to the stickiness of inflation. Even with the support of the BTC halving trend, the liquidity scale of returning to the crypto market may be minimal under the high interest rates.
- The approval of spot ETFs may help boost investor expectations, which may cause the risk-free rate to cross with the expected rates of BTC and ETH earlier. However, if the approval of ETFs is not accompanied by interest rate cuts, the increase in BTC and ETH may be limited. Interest rate cuts are a prerequisite for the start of the bull market; considering the relatively steady pace of the Fed’s interest rate cuts, the speed and scale of liquidity release will also be relatively stable. At the same time, considering that the crypto market is at the end of the liquidity chain, it may be difficult to experience a “liquidity flood” similar to 2021; liquidity is no longer cheap.
Therefore, the new round of the bull market may be a “slow bull.” It is difficult for the crypto market to experience a “tachycardia” similar to that in 2021, but it will also return to a relatively normal level of volatility.
Disclaimer
This report is based on public sources considered to be reliable, but Blofin does not guarantee the accuracy or completeness of any information contained herein. The report had been prepared for informative proposes only and does not constitute an offer or a recommendation to purchase, hold, or sell cryptocurrencies (tokens) or to engage in any investment activities. Any opinions or expressions herein reflect a judgment made as of the date of publication, and Blofin reserves the right to withdraw or amend its acknowledgement at any time in its sole discretion. Blofin will periodically pr irregularly track the subjects of the reports to determine whether to adjust the acknowledgement and will publish them in a timely manner.
Blofin takes its due diligence to ensure the report provides a true and fair view without potential influences of any third parties. There is no association between Blofin and the subject referred in the report which would harm the objectivity, independence, and impartiality of the report.
Trading and investing in cryptocurrencies (tokens) may involve significant risks including price volatility and illiquidity. Investors should fully aware the potential risks and are not to construe the content of the report as the only information for investment activities. None of the products or Blofin Inc, nor any of its authors or employees shall be liable to any party for its direct or indirect losses alleged to have been suffer on account thereof.
All rights reserved to Blofin.