

A gradual inversion of the term structure of ATM volatility has resulted in it taking a drastically different shape from the one it has taken since the ETF application event risk was first known. Until now, options markets had priced for a sustained increase in volatility following mid-Jan, without explicitly inverting. Vol levels across the smile have also fallen, and smiles at all tenors are skewed towards OTM puts. This suggests longer-term demand for downside protection following the expected announcement date.
Volatility Inversion
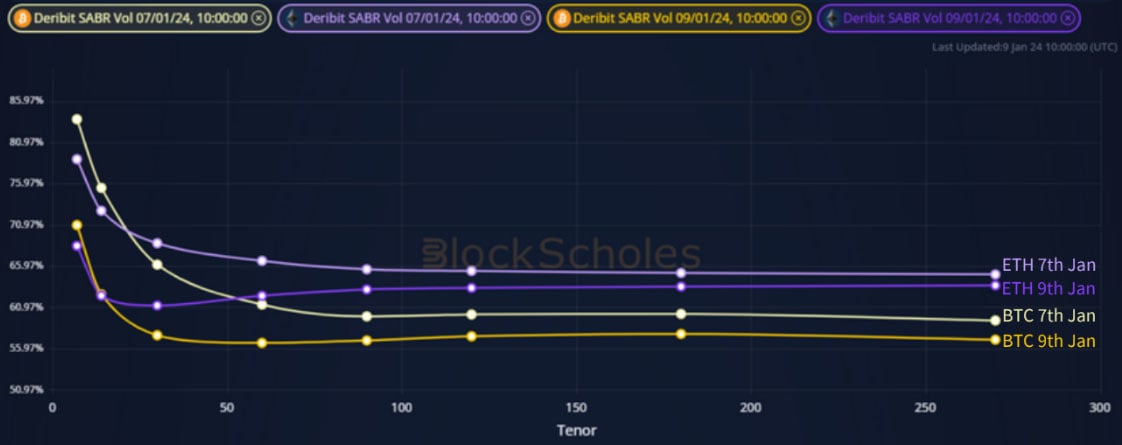
Figure 1 Term structure of BTC (yellow) and ETH (purple) SABR ATM volatility at two snapshots (see legend). Source: Block Scholes
- BTC and ETH’s ATM term structures are inverted.
- We have seen the level of each term structure fall by 5% since the 7th Jan.
- The level of inversion has also moderated as the front end of the term structure has fallen further.
- While levels at the front end remain similar between assets, ETH markets price for a high level of vol at later tenors, implying that the market expects to see shared volatile reactions to the ETF with a more volatile path for ETH in the months to follow.
Volatility Retraces
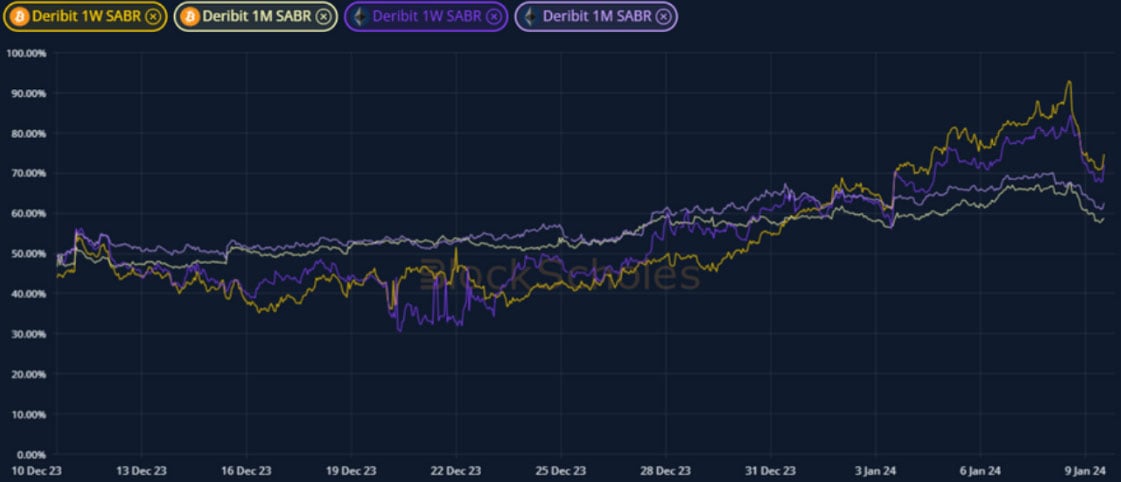
Figure 2 Hourly BTC (yellow) and ETH (purple) SABR ATM volatility at 1-week (darker colours) and 1-month (lighter colours) tenors over the last month. Source: Block Scholes
- An inversion in the volatility term structure is to be expected when there is a known event risk like the deadline for ETF application responses.
- However, until recently we have seen that event risk manifest as a step-jump in the term structure at the tenor closest to mid-January.
- Now, expiries later than the event are much lower after short-tenor vols continued to rise and longer-term optionality stayed level.
- Why did we not see this inversion as soon as the date was known? Why does vol at longer tenors no longer match vols at the January expiry?
Smile Skew Towards Skew
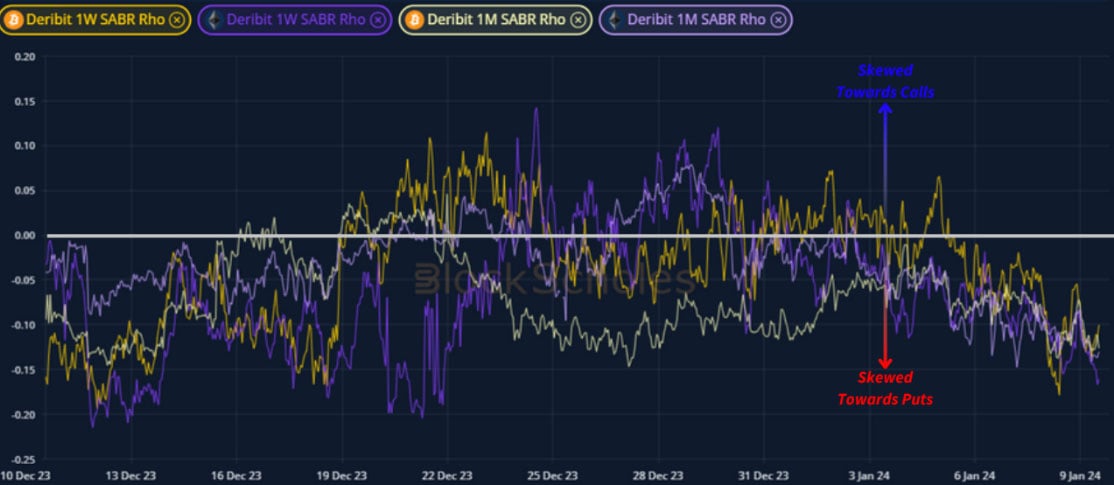
Figure 3 Hourly SABR Rho (skew parameter of smile calibration) of BTC (yellow) and ETH (purple) smiles at 1-week (darker colours) and 1-month tenors. Source: Block Scholes
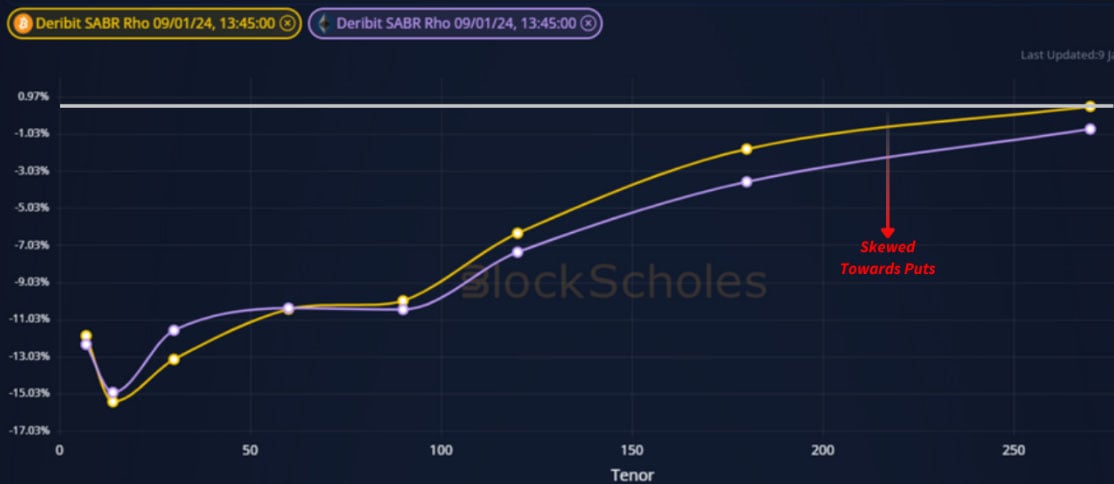
Figure 4 Term structure of SABR Rho (skew parameter of smile calibration) for BTC (yellow) and ETH (purple) at a 13:45 UTC 2023-01-09 snapshot. Source: Block Scholes
- We observe a shift in options markets towards more bearish positioning.
- The skew of both BTC and ETH’s volatility smiles has swung strongly towards puts.
- We saw a similarly bearish dive ahead and in the aftermath of the spot market retrace on the 10th of December, but this time the shift is not limited to the 1-week tenor.
- Then, we rationalised the bearish positioning as protecting long spot positions against short-term volatility while waiting for a spot ETF announcement in January.
- Now, the relative demand for puts appears to extend much further across the term structure.
AUTHOR(S)
Trading with a competitive edge. Providing robust quantitative modelling and pricing engines across crypto derivatives and risk metrics.