

BTC’s spot price has stuck to a tight $22.3-22.4K price range since a swift move downwards on the 3rd March. That has returned realised volatility to levels seen in early February, but a continuation of current sideways price action would see it continue to fall. Should implied volatility remain elevated over the same period, we could see a repeat of December’s implied volatility dominance over realised volatility.
Spot Price
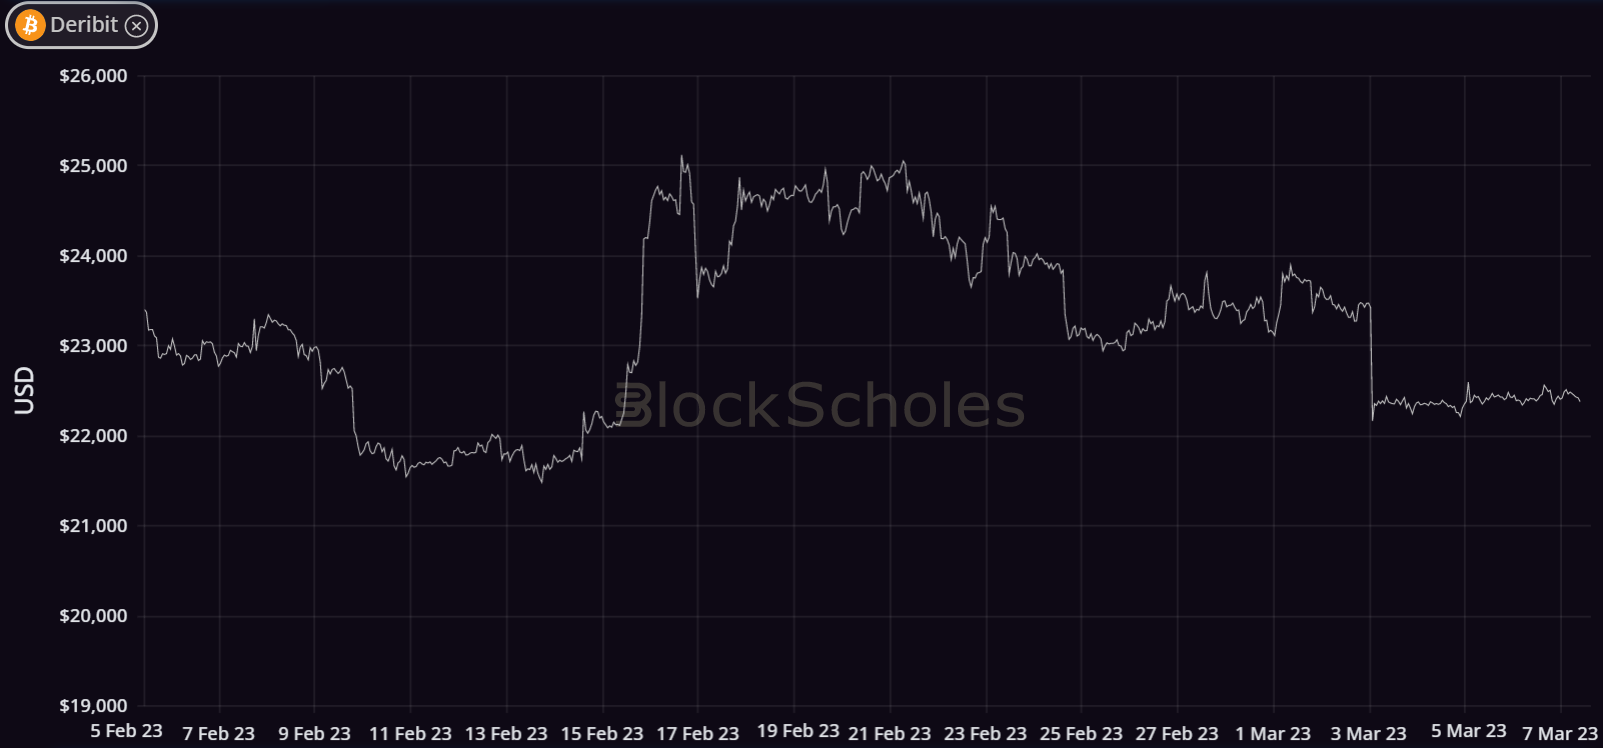
Figure 1 Hourly BTC perpetual swap price from 5th Feb 23 to 7th Mar 23. Source: Block Scholes
- After an abrupt selloff on Friday the 3rd of March, BTC’s spot price action has moved sideways near to $22.3K.
- This returns BTC’s price to the lower end of its monthly range, further from the $25K price point that markets tested on several occasions in February.
- We last saw similar tight range bound action in December, following FTX’s collapse.
- However, this week’s sideways action has not yet seen volatility fall to the same levels.
Realised Volatility
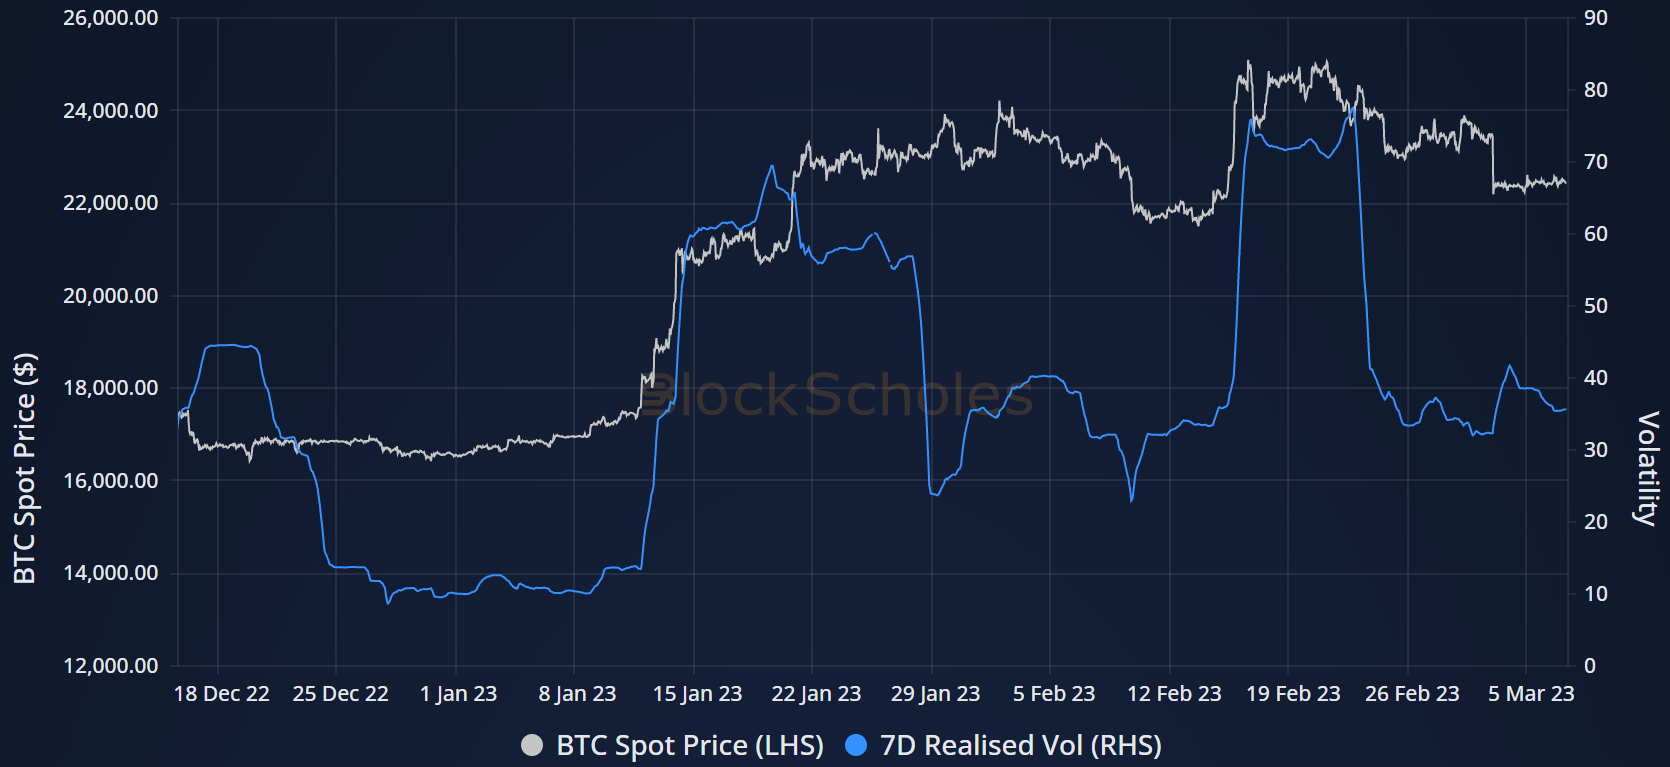
Figure 2 Hourly BTC spot price (white) and realised volatility with a 7-day (blue) and 14-day (yellow) lookback window from 18th Dec 23 to 7th Mar 23. Source: Block Scholes.
- Whilst Friday’s swift move down increased the 14-day realised volatility, it’s levels remain in contrast to the higher 60-80% range seen in January and February.
- Current levels now match the brief period of calm that interspersed the volatile moves in both of the first two months of the year, and are much lower than in the middle of February.
Implied Volatility
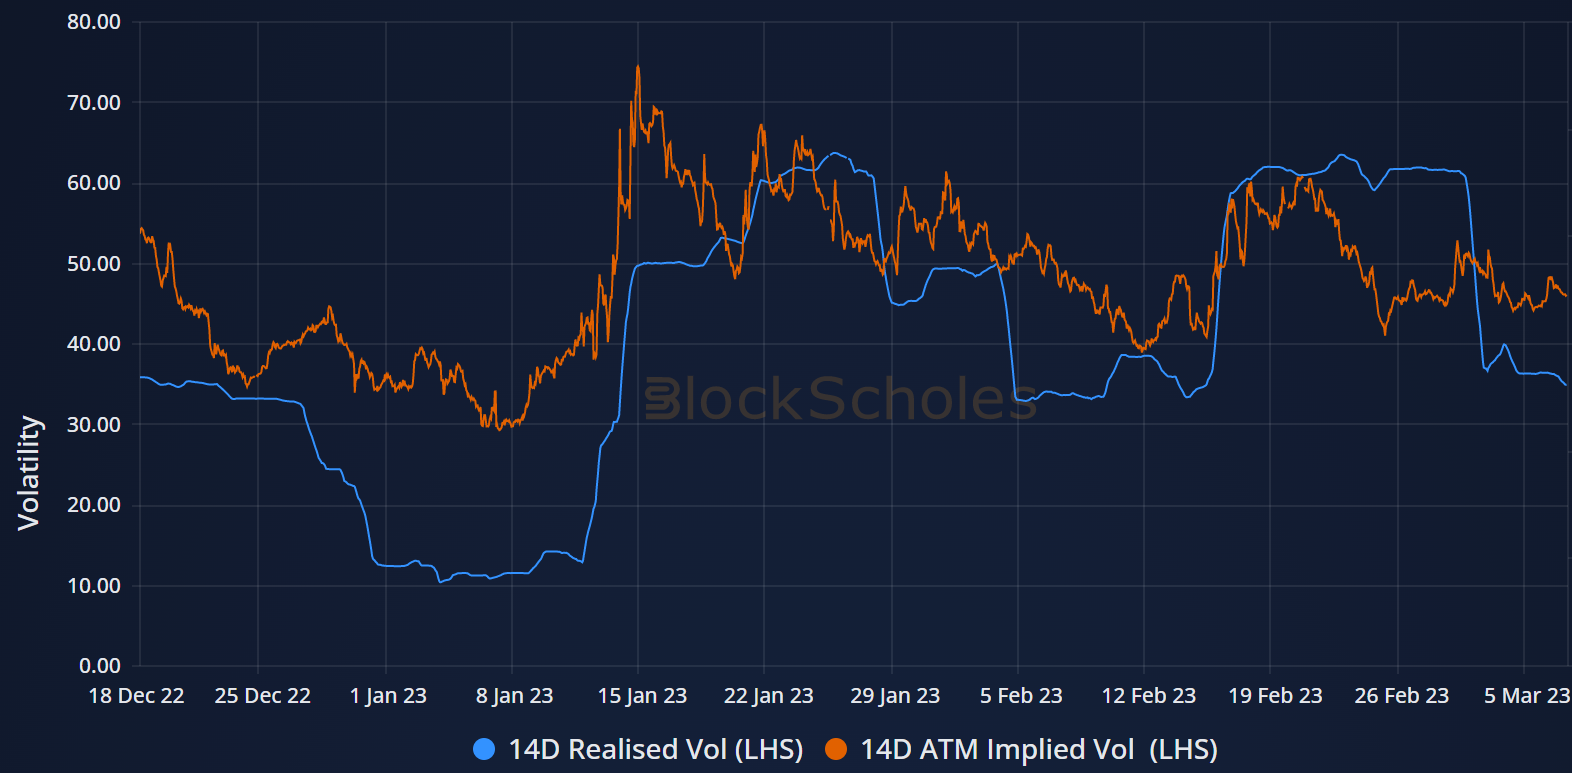
Figure 3 Term structure of SABR rho parameter for BTC (orange) and ETH (purple) options markets from a 09:21 21-02-2023 (UTC) snapshot. Source: Block Scholes
- Realised volatility has also fallen below the volatility implied by options with a comparable tenor.
- A spike in the implied-to-realised volatility ratio suggests that options markets are pricing for higher volatility in the near future than observed in the near past.
- Volatility implied by a 14-day tenor option struck ATM is now at 46%, whilst realised volatility over the last 14 days is just 35%.
- However, the difference between observed and expected volatility can persist for some time, as shown by the extended dominance of implied volatility in December of last year.
AUTHOR(S)
Trading with a competitive edge. Providing robust quantitative modelling and pricing engines across crypto derivatives and risk metrics.