

The correlation between the daily spot price moves of BTC and ETH recorded a sharp drop on the 8th of November, taking the rolling 90-day correlation down to levels that we have not seen since the first rally to an all-time high in early 2021. While the drop in correlation does not necessarily indicate a repeat of that price action, it does provide important context on the market structure of previous bull cycles. However, the implied volatility of both majors indicates that markets are bracing for similarly volatile price action in the near future, having pulled volatility pricing up from its summer all-time low levels.
BTC and ETH less correlated
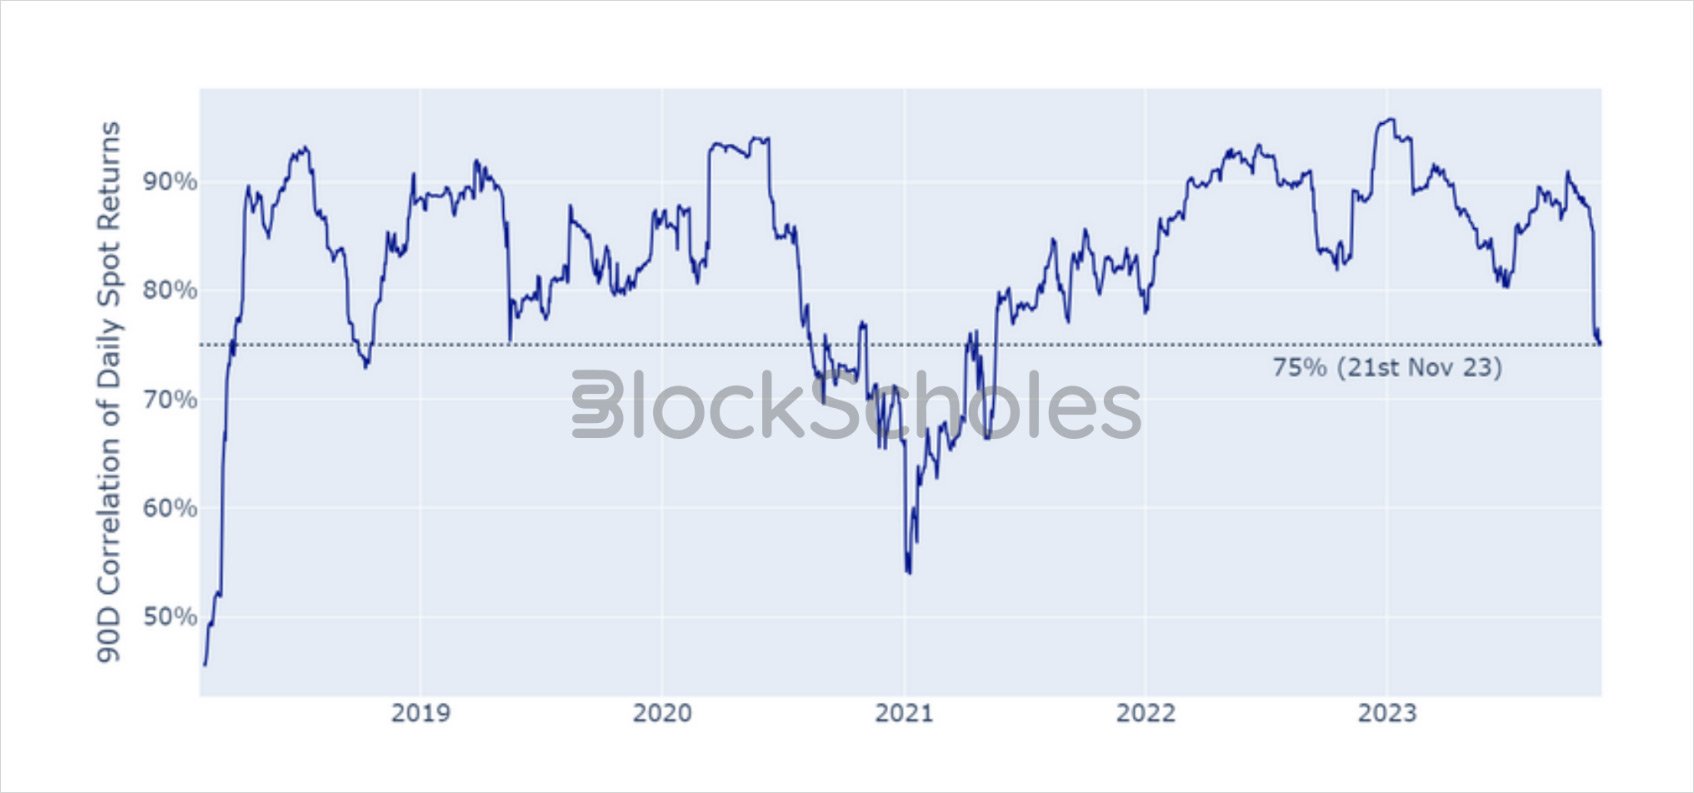
Figure 1 90-day rolling correlation of daily spot returns between BTC and ETH since 1st February 2018. Source: Yahoo Finance, Block Scholes
- Despite joining in on the upwards rally, ETH’s spot price has sharply reduced its correlation to BTC’s spot price.
- The swift divergence began on the 8th of November, taking the correlation between the daily moves of BTC and ETH to levels that we have not seen since early 2021.
- We have previously noted the difference in the behaviour of each asset’s derivatives market as ETH future-implied spot yields continue to lag behind BTC’s.
Lower correlations
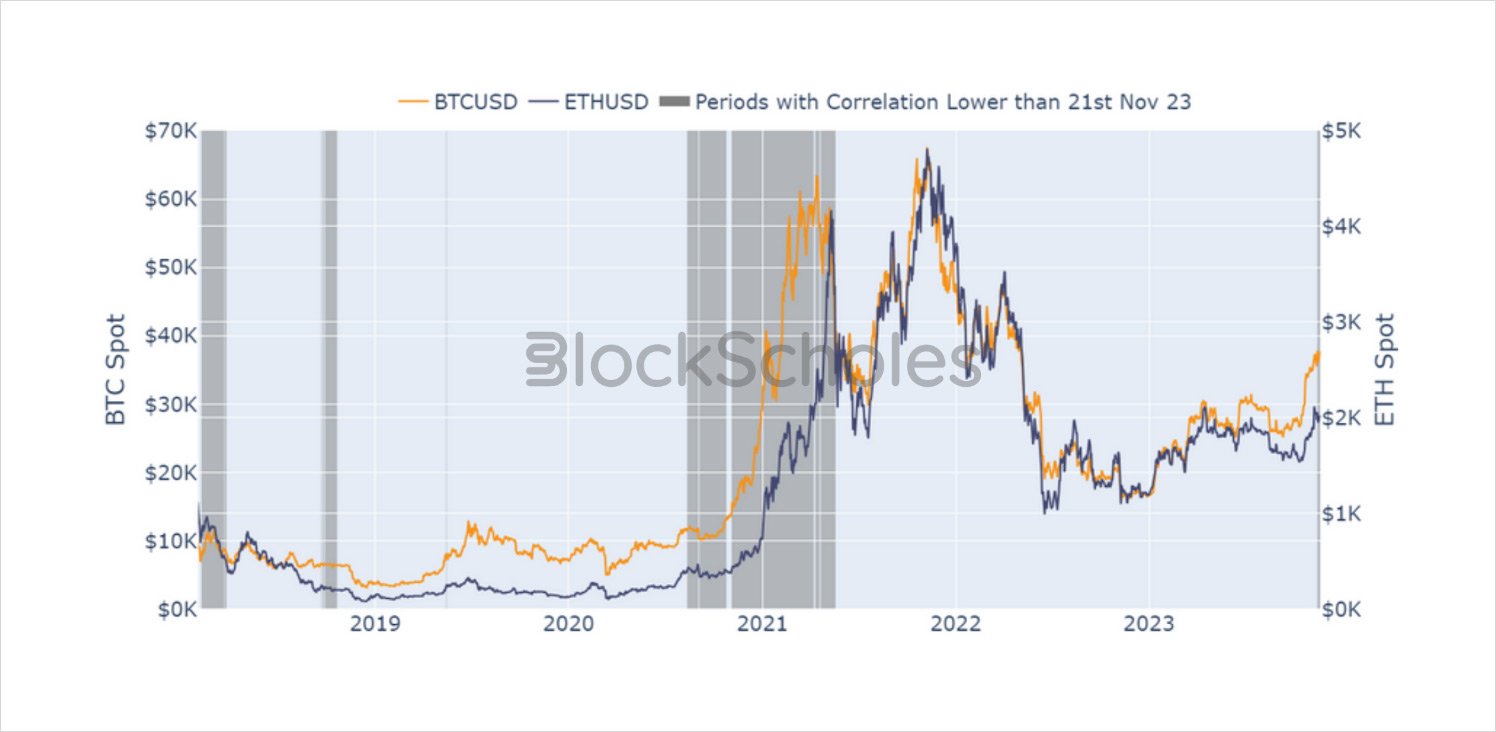
Figure 2 The spot prices of BTC (yellow) and ETH (blue) since 1st Feb 2018, with periods of 90D rolling correlation lower than the value recorded on 21st Nov 2023 shaded in grey. Source: Yahoo Finance, Block Scholes
- While they remain highly correlated, the swift fall indicates a recent change in the relationship between the two assets.
- The last time we saw correlation values this low was in late 2020 and early 2021.
- In that case, the correlation fell as a result of BTC’s strong out-performance in its run to an all-time high and did not recover until ETH “caught up” with a rally of similar magnitude.
- While a similarly low correlation does not necessarily precipitate a repeat of that action, this period does provide context on the market structure during the last bull cycle.
Implied Volatility back on Par
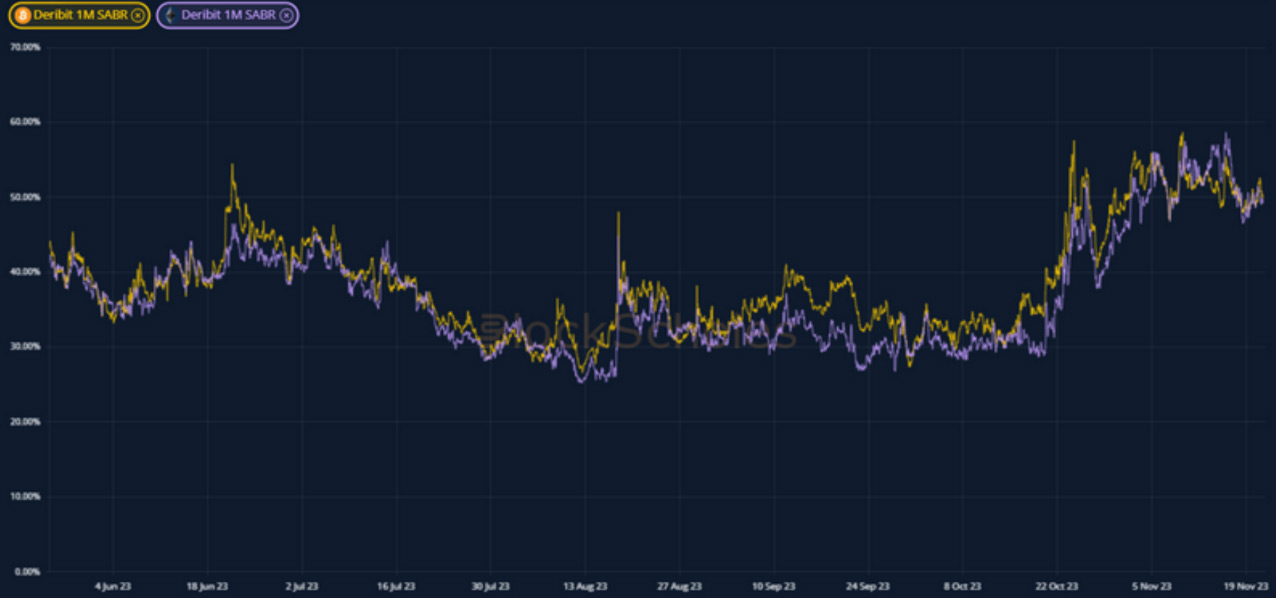
Figure 3 Hourly 1-month tenor ATM implied volatility for BTC (yellow) and ETH (purple) options since 21st May 2023. Source: Block Scholes
- While their spot prices have reduced the correlation to each other’s movements, their levels of implied volatility have returned to similar levels.
- ETH volatility has previously been trading below that of BTC, a trend that we have followed intently since the Merge in September of last year.
- Those levels had recovered significantly and persistently since scraping close to the all-time low values that we recorded over the summer.
- This suggests that, no matter which token leads, markets are now bracing for a volatile period in both assets.
AUTHOR(S)
Trading with a competitive edge. Providing robust quantitative modelling and pricing engines across crypto derivatives and risk metrics.