

The term structures of both major assets’ at-the- money implied volatility display a significant rise in volatility expectations near to a 60 day tenor, suggesting that a larger volatility premium is being commanded for expiries later than the end of January. The divergence between the vol levels indicates that longer-dated volatility is in higher demand, which traders may be funding by the selling of shorter-term optionality. While the skew of BTC’s vol smile is further towards calls at the back end of the term structure, ETH’s bearish skew between 3- and 6-month tenors highlights the different expectations for both assets following the resolution of the dominant ETF narrative.
A 60D Kink
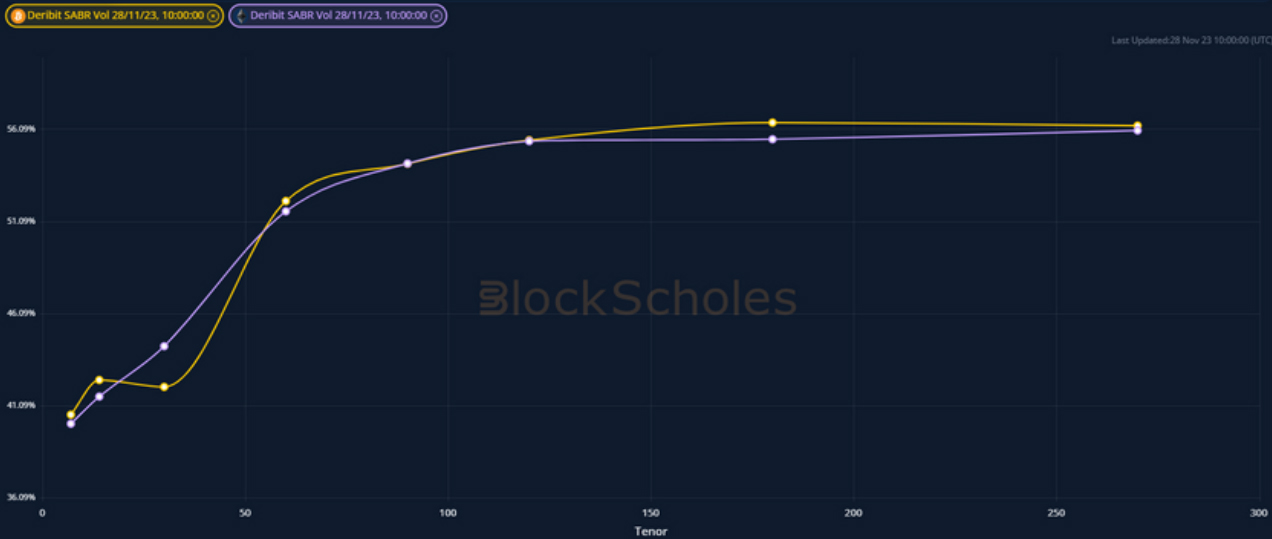
Figure 1 Term structure of at-the-money implied volatility for BTC (yellow) and ETH (purple) at a 10:00 UTC 2023- 11-28 snapshot. Source: Block Scholes
- We observe a significant “kink” in the term structure of implied volatility for both major crypto- assets that begins at a 60-day tenor.
- In general, we expect to see a steep term structure to ATM volatility as volatility sellers demand an uncertainty premium on top of the recently delivered level of volatility.
- In this case, we see a very clear premium on volatility that begins close to the 60-day tenor, which is near January’s end-of-month expiry on Friday the 26th.
The Development Of The Future
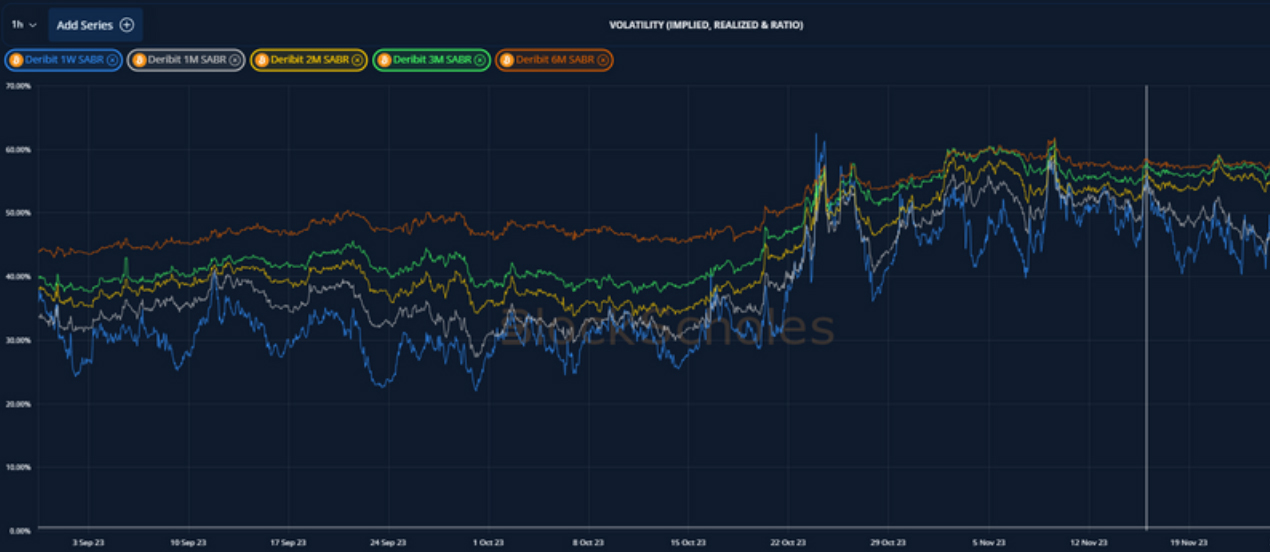
Figure 2 Hourly, SABR modelled, at-the-money implied volatility at several tenors across the term structure from 1st Sep 23. Source: Block Scholes
- The divergence between the levels of implied volatility began near the 15th of November.
- It was volatility at shorter tenors that began to drift lower while volatility at tenors longer than 2 months has remained in a tight spread close to 55%.
- Since then, BTC’s realised volatility has held close to 40%.
- This could suggest that traders are funding longer-term optionality with calendar spreads, increasing the supply of short-term vol in order to position for the decision of an ETF application.
Skewing Towards Calls
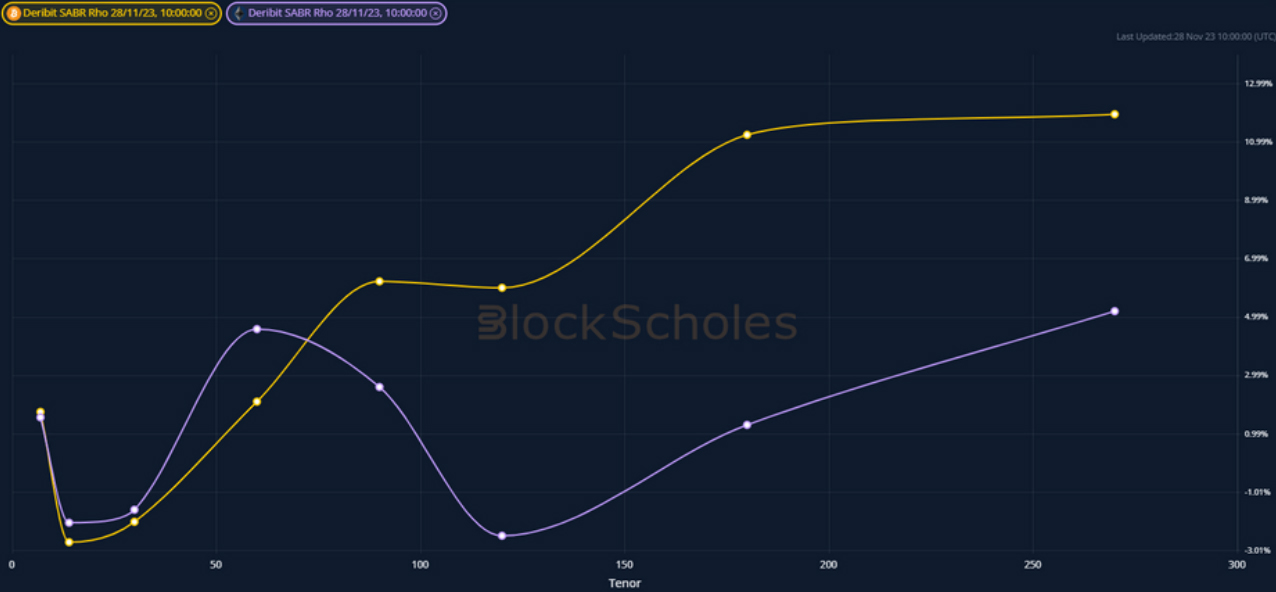
Figure 3 Term structure of SABR model skew parameter “rho” for BTC (yellow) and ETH (purple) at a 10:00 UTC 2023-11-28 snapshot. Source: Block Scholes
- The chart above plots the term structure of the skew towards puts (negative) or calls (positive), as measured by the “rho” parameter of the SABR volatility smile calibration for each tenor.
- Longer-term BTC smiles are heavily skewed towards calls in anticipation of the realisation of several bullish narratives: the ETF, the halving, and possible macro tailwinds.
- ETH’s term structure holds a wildly different shape after the 2-month tenor, returning to a skew closer to puts than calls for tenors between 3 and 6 months.
- This highlights the difference in sentiment for the two assets in the medium-to-longer term, and possibly hints at different reactions to an ETF decision.
AUTHOR(S)
Trading with a competitive edge. Providing robust quantitative modelling and pricing engines across crypto derivatives and risk metrics.