
Short-tenor BTC volatility smiles have skewed sharply towards OTM puts in the last two days. This is due to an increase in the relative demand for puts, rather than a scaling back of long positions. While this could indicate speculative bearish bets, it could also suggest that traders are looking to take profit on their long spot positions or protect against interim retraces of the most recent rally. The ATM level of volatility priced by the market over the next week has fallen some 2.5% vol points, but the vols of OTM puts remain high into year-end.
Short Term Put Skew
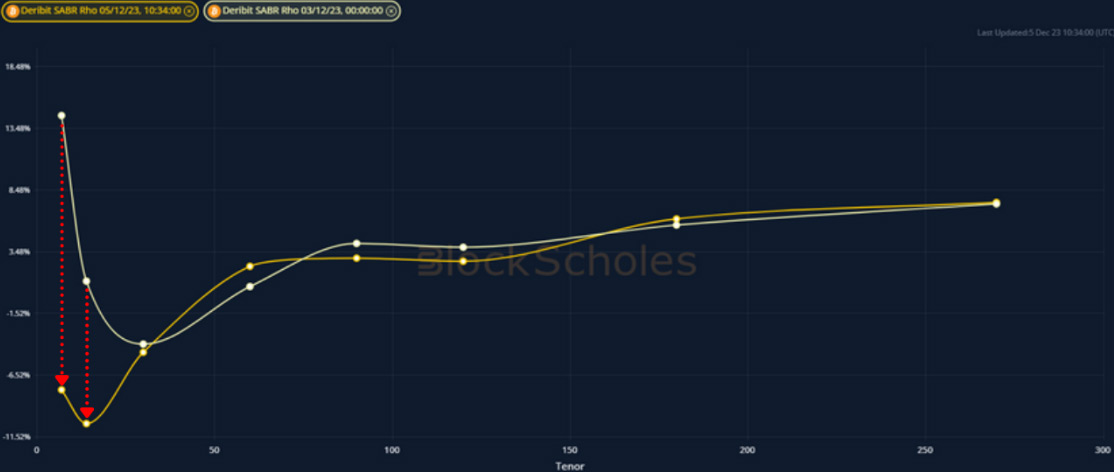
Figure 1 Term structure of at-the-money implied volatility for BTC at 10:34 UTC 2023-12-05 (dark yellow) and 00:00 UTC 2023-12-03 (light yellow) snapshots. Source: Block Scholes
- Short-tenor BTC volatility smiles have skewed strongly towards OTM puts over the last two days.
- This is measured in the chart above by the SABR calibration “rho” parameter, which measures the skew of the volatility smile towards call (positive) and puts (negative).
- This is a significant move away from the sharp skew towards OTM calls just two days ago, and moves against the bullish positioning that we see at tenors of 1 month or longer.
Call And Put Vol Levels
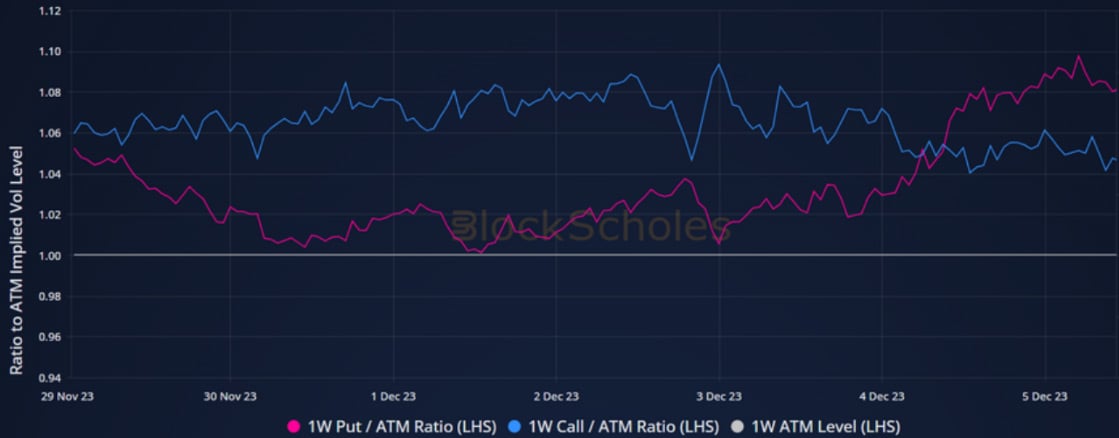
Figure 2 Ratio of the implied volatility of 7-day 25-delta calls (blue) and puts (pink) above the level of volatility of options struck at-the-money (grey line at 1). Source: Block Scholes
- The hard skew towards OTM puts can be largely attributed to the increased demand for short-term downside protection, and not to a significant fall in demand for OTM calls.
- While the implied vol of OTM calls has drifted downward relative to the level of vol implied by options struck ATM, the implied vol of similarly OTM puts has risen to 110% of the ATM level.
- This could echo similar sentiments in equity markets that the recent rally has over-run.
- However, this could also be attributed to profit taking from traders who are long spot BTC, looking to protect against any fall in spot price ahead of January’s expected bullishness.
Smile Skew Evolution
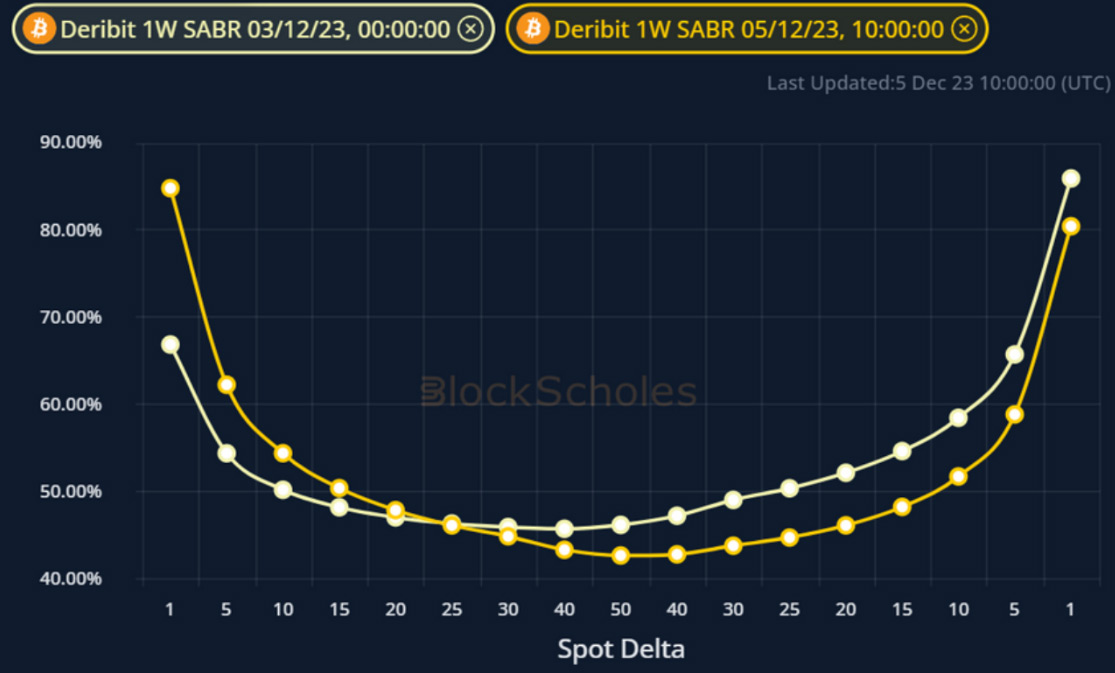
Figure 3 BTC SABR calibrated volatility smiles at a 1 week tenor at 10:00 UTC 2023-12-05 (dark yellow) and 00:00 UTC 2023-12-03 (light yellow). Source: Block Scholes
- The evolution of the 1-week volatility smile shows that the ATM level has dropped slightly.
- The ratios plotted in Figure 2 show that the 25-delta call IV has fallen by a proportional amount.
- However, the smile evolution in the chart above highlights the rise in implied volatility of OTM puts over the last two days, on the left-hand side of the smile.
- While the outright level of implied volatility is broadly similar, the premium assigned to downside protection relative to the rest of the market has risen substantially.
AUTHOR(S)
Trading with a competitive edge. Providing robust quantitative modelling and pricing engines across crypto derivatives and risk metrics.