


In the previous lecture we mentioned that the vega of an option is not static. One variable that has a major influence on vega is the underlying asset price, and where it currently is relative to the strike price of the option.
Let’s take a look at multiple options that share the same underlying asset price, days to expiry, and implied volatility. The only difference between these options is of course the strike price, and therefore where they sit relative to the underlying asset price.
This chart shows the vega for all options of a fictional asset with a current price of $100, 30 days to expiry, and implied volatility (IV) of 40%. The strikes range from $50 to $150.
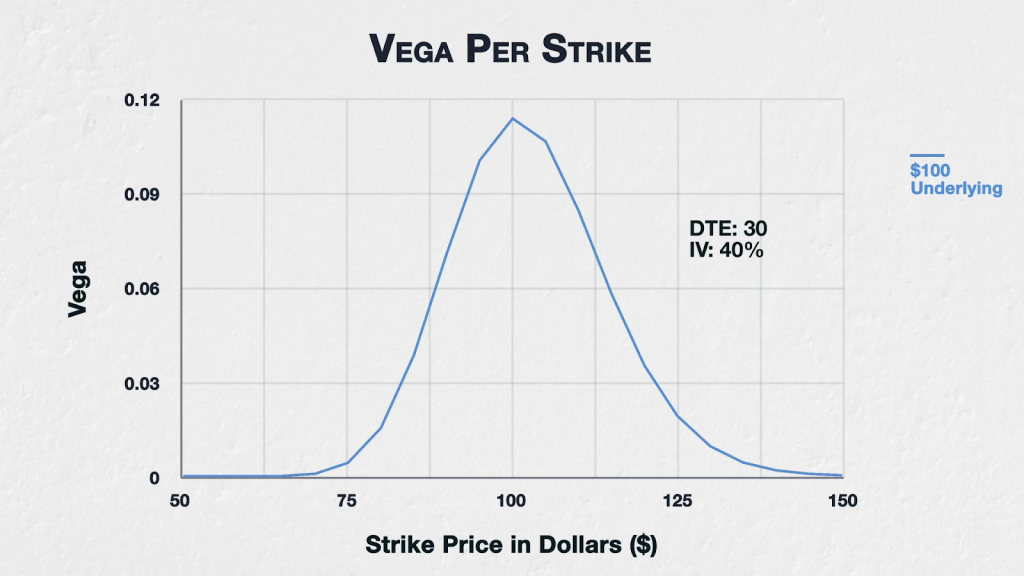
Vega is the same for the call and put at each strike price, so I’ve just titled this chart ‘Option Vega Per Strike’. The underlying price is $100, and as you can see, this is where vega is the greatest. This means that the ATM options with a strike price of $100, will gain the most value if IV increases by 1%, and will lose the most value if IV decreases by 1%.
The $100 strike options have more vega than both the $90 and $110 strike options. If we move further away from the underlying price, this trend continues. The $80 strike options have less vega than the $90 strike options, and the $120 strike options have less vega than the $110 strike options.
More generally, though the peak of vega can be a higher price if IV or DTE are much higher, vega is usually greatest for ATM options. Vega then reduces as we move further away from the underlying price in either direction, though not in a perfectly symmetrical manner. The further away from the current underlying price we move, the lower the vega for that option.
If the underlying price was $80 instead, it would be the ATM options with a strike of $80 that now have the most vega. Meaning they have the greatest sensitivity to changes in implied volatility.
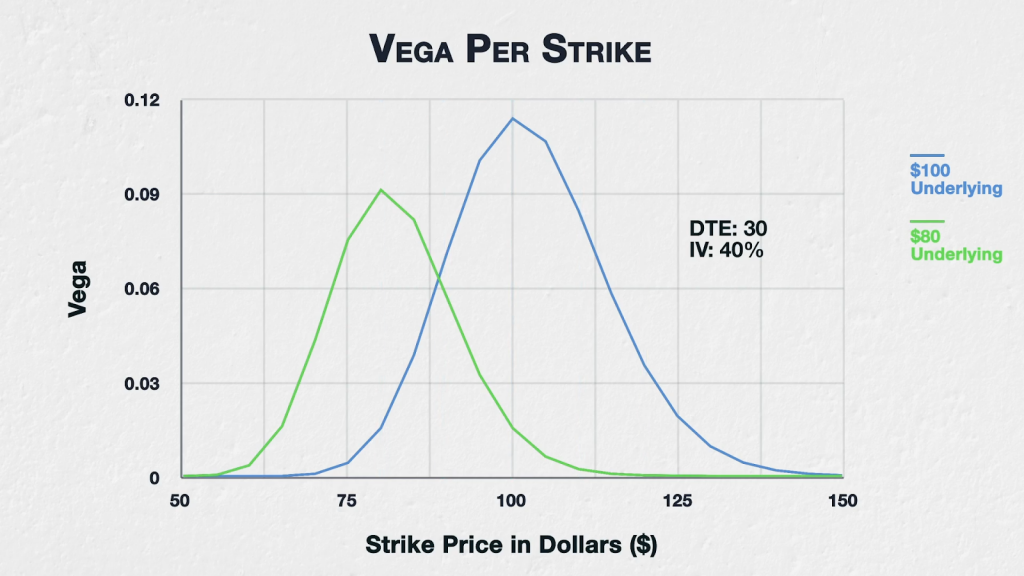
Vega still decreases in both directions as we move through the strike prices, away from the current underlying price of $80.
Tastyworks example
We can see this in action in a live setting as well. Here is the option chain for the December expiry of SPX.
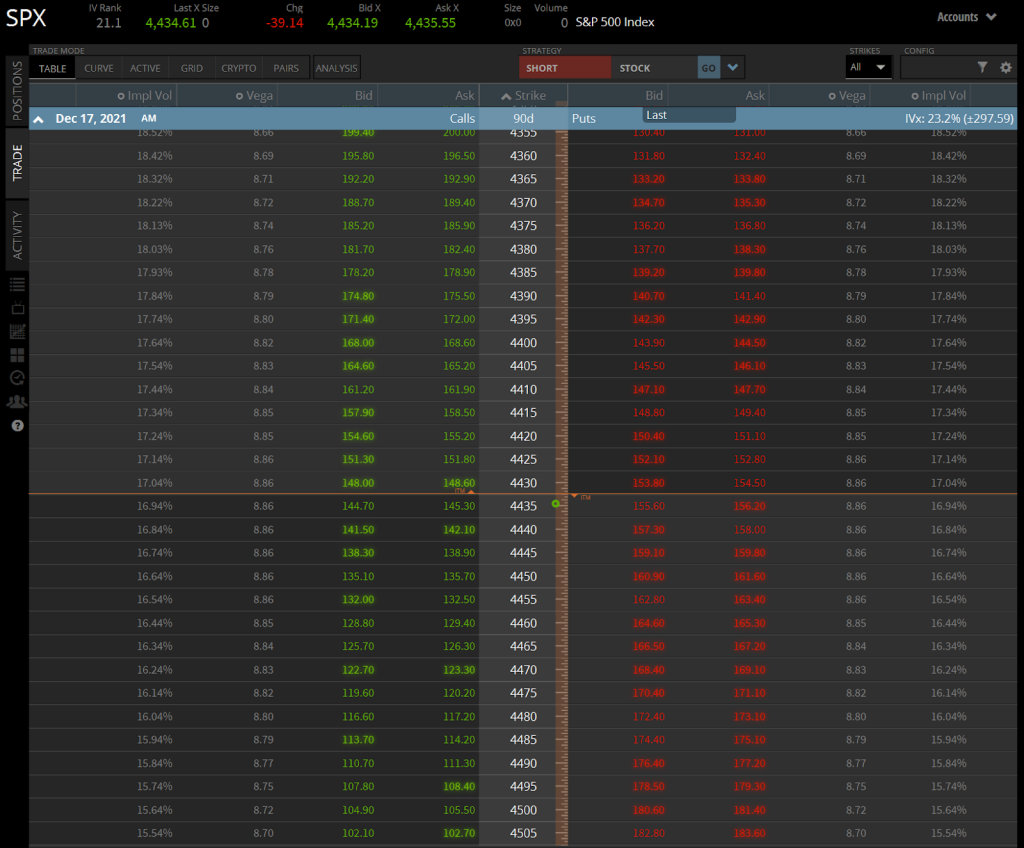
I’ve added the vega as a column here, which we can see on the call and put sides of the chain. As we mentioned earlier vega is the same for puts and calls of the same strike, so we need only look at one. Let’s use the call side on the left. As we can see vega is greatest for the strikes that are closest to the money. This UI only shows vega down to two decimal places, so we see all of the strikes from 4425 up to 4455 showing as $8.86 of vega.
If we move down in strike price (which is up in the option chain) we can see that vega decreases as we continue to move lower in strike price. To the upside we see the same. As we move higher in strike price (which is down in the option chain) we see that vega decreases as we continue to move higher in strike price.
So the options in this live option chain are displaying the same type of behaviour as the theoretical examples we began with.
In summary
Where the strike price of an option is in relation to the underlying price, will have an impact on the vega of that option.
Calls and puts of the same strike price and expiration date, share the same vega figure.