

In this lecture we will be discussing risk reversals. A short risk reversal is also sometimes known as a collar. Risk reversals and collars involve either a long put combined with a short call, or a short put combined with a long call. Both options are usually OTM. These option legs are sometimes also combined with a position in the underlying (long or short).
Some uses for risk reversals include:
-Speculating on price direction by approximately replicating a long or short in the underlying.
-Speculating on skew, often including a delta hedge.
-Hedging an existing position in the underlying.
Speculating on price
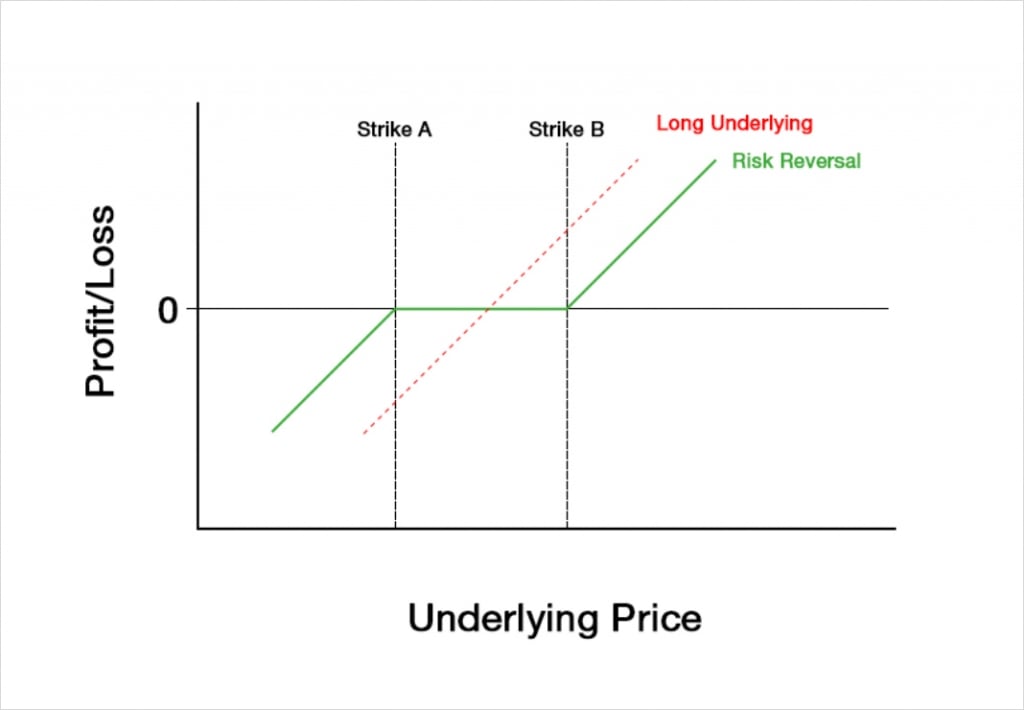
When used to speculate on the underlying price, a risk reversal can be used to approximate a long position in the underlying, while a short risk reversal can be used to approximate a short position in the underlying. While an option position with two legs is more complicated than a simple long/short in the underlying, the option position can benefit from price differences between the two options, and the choice of strikes (i.e. choosing precisely where the position will start making a profit or loss).
Trading skew
Another way risk reversals are used is to trade skew. We gave a simple introduction to skew in lecture 7.6. As a brief recap, if the Black Scholes option pricing model perfectly modelled the real world, then the implied volatility (IV) of each strike would be the same. However, in practice this is not the case, and different strikes will often have different IV levels. Skew is a way of measuring and describing these differences.
As an example, if the underlying price of bitcoin falls significantly, put skew may become elevated as demand for protective puts increases. This means the implied volatility for OTM puts will be far higher than for OTM calls. One way a trader could choose to speculate that this skew will decrease in magnitude, is by executing a risk reversal by selling a put they deem to be relatively expensive and buying a call they deem to be relatively cheap. To reduce the directional risk the trader may also choose to delta hedge this option position with a position in the underlying.
Hedging a position in the underlying
Although risk reversals can be executed with or without an accompanying position in the underlying, and in either direction, in this lecture we will mostly focus on a long position in the underlying that has been hedged with a short risk reversal, aka a collar. This strategy involves a long position in the underlying, which is then combined with a long OTM put, and a short OTM call.
As a side note, be sure to clarify which direction you are talking about when discussing any option strategies with others, as it is common for people to confuse the long/short version of a particular strategy, or use different terminology to describe a particular structure. Where possible, a profit/loss chart will be a useful aid to option discussions. Failing that, a list of which options are being bought/sold will avoid any misunderstandings.
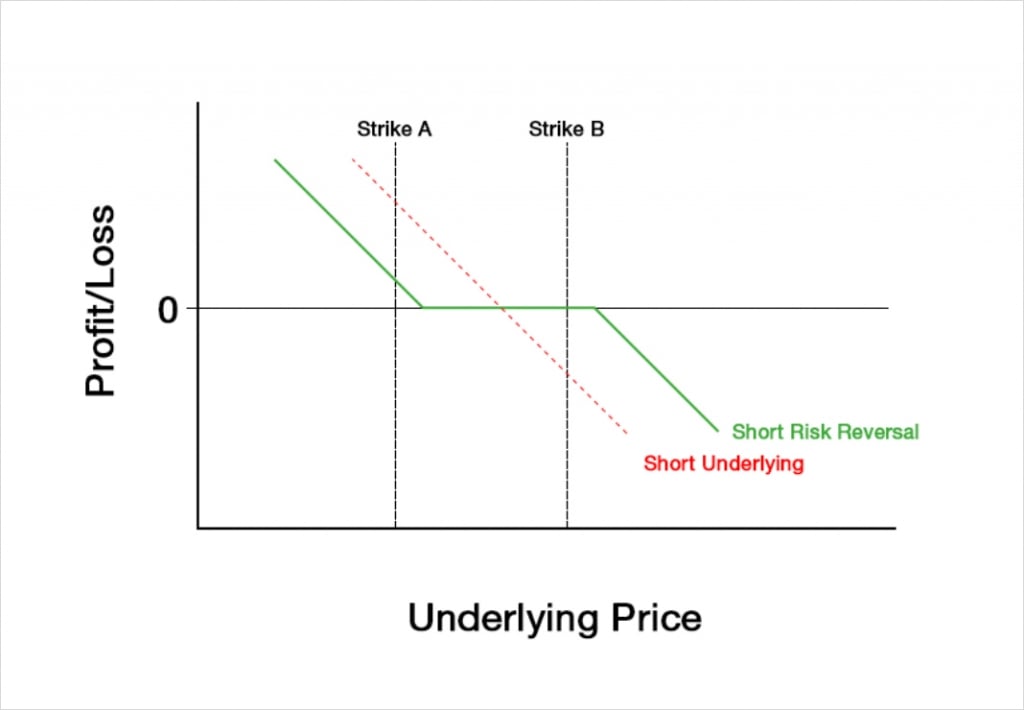
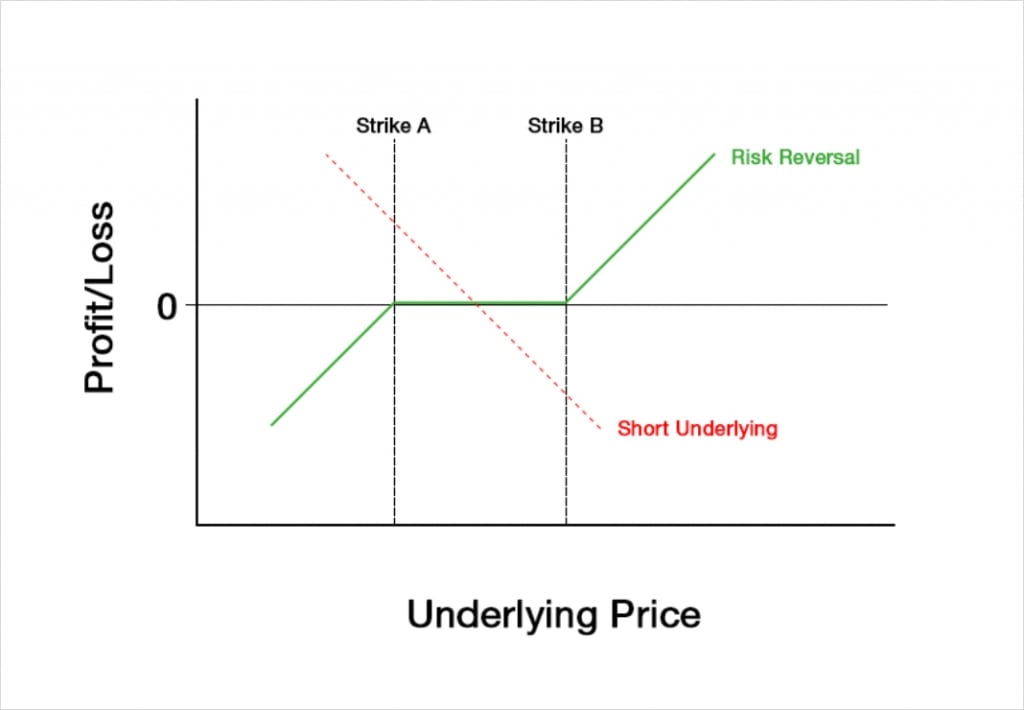
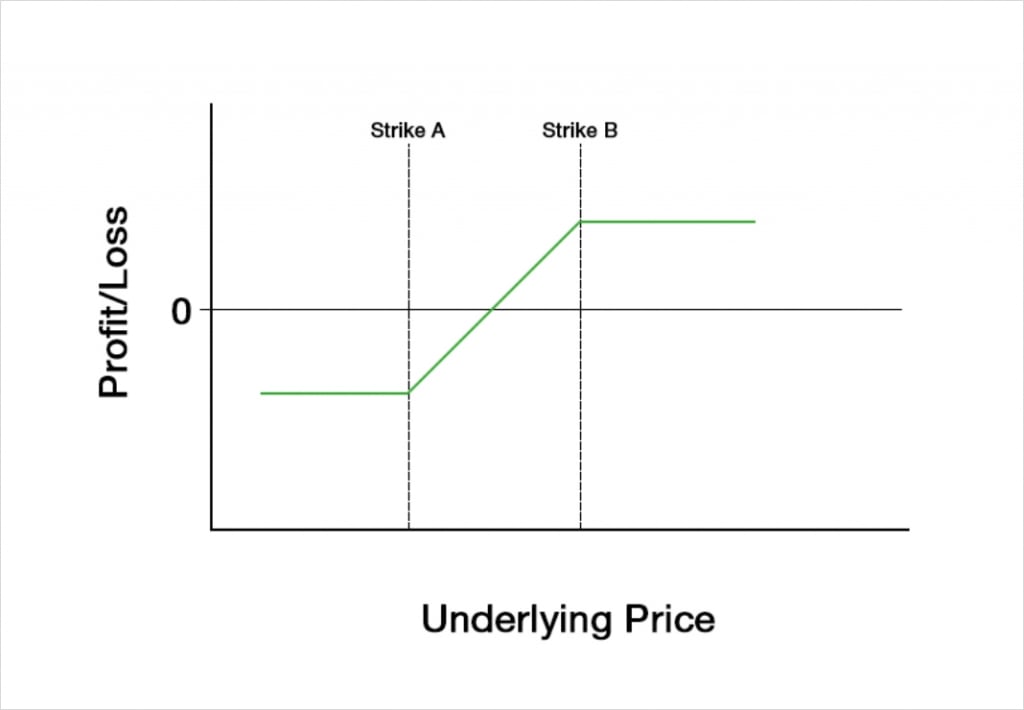
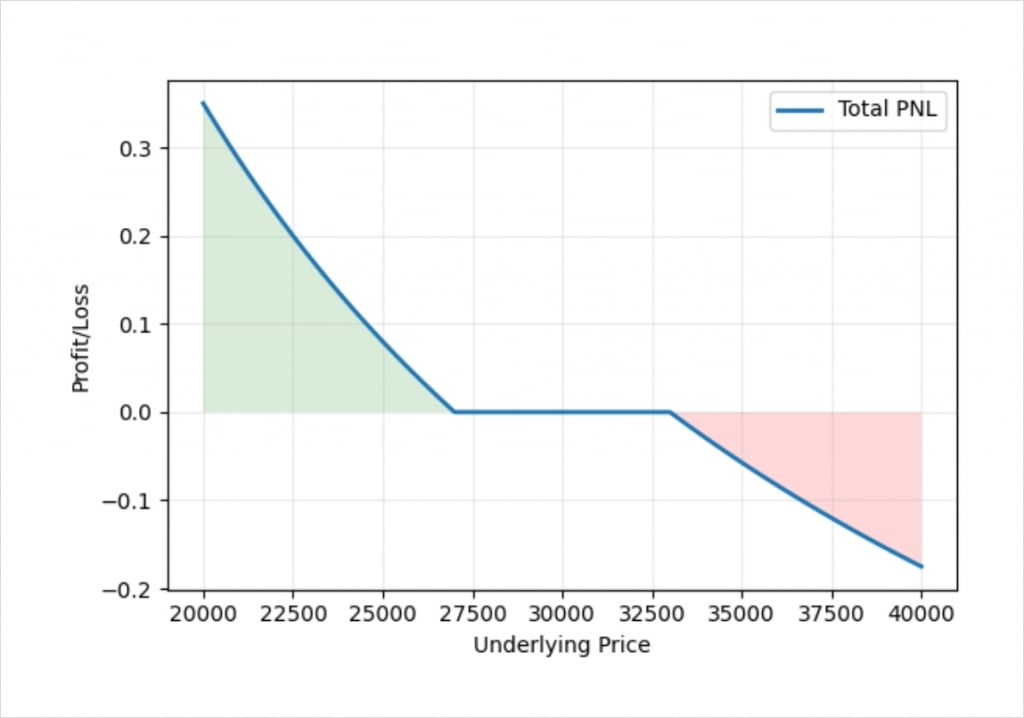
With a short risk reversal, we are long an OTM put at strike A, and short an OTM call at strike B. These options by themselves create this payoff.
The options by themselves create a payoff that is initially similar in shape to being short the underlying, but with a flat section in the middle between the strikes where no profit or loss is made. We have (almost) unlimited profit to the downside and unlimited risk to the upside.
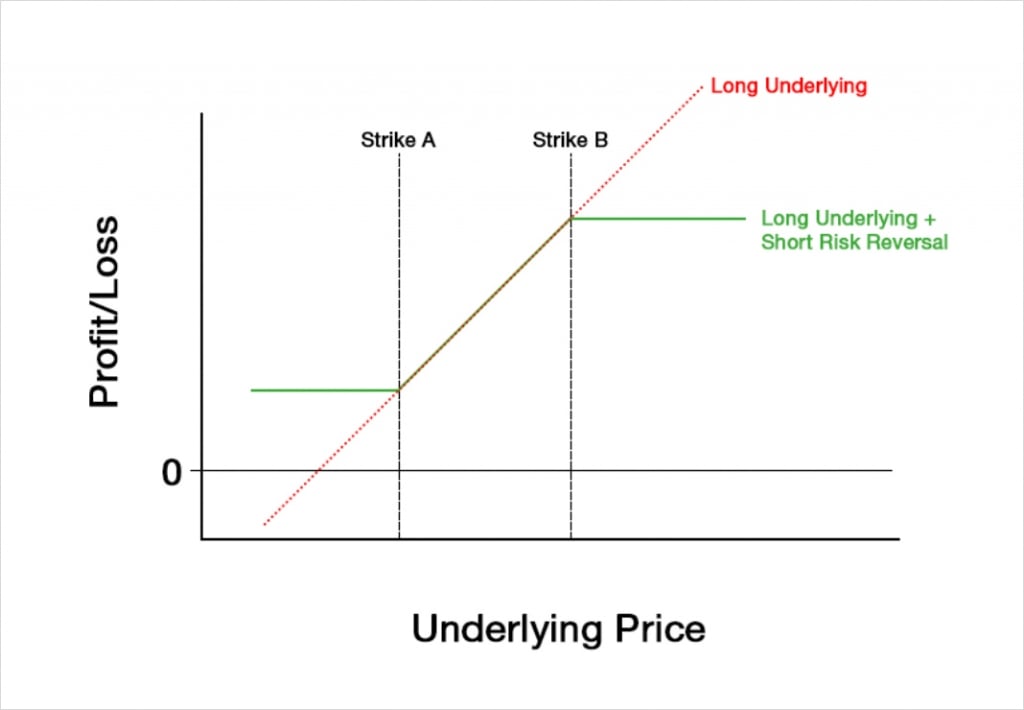
A long position in the underlying of course has a linear payoff with a risk to the downside that is only capped by the price hitting zero, and unlimited potential profit to the upside. When we combine the options with a long position in the underlying though, we get this payoff.
Notice how this payoff looks remarkably similar to the payoff for a bull call spread or a bull put spread. We’ll come back to this similarity shortly when we look at the Greeks.
By adding a short risk reversal, we turn a long position in the underlying, which has unlimited risk and unlimited potential profit, into a position where we have a fixed risk and a fixed maximum profit. We put a cap on our risk to the downside, but this comes at the cost of also capping our potential gains to the upside.
When we initiate this strategy the underlying price will be somewhere between strikes A and B, and we will usually try to execute the two option legs for a price that is close to zero.
Protecting unrealised gains in a position in the underlying
It is possible to use a short risk reversal (aka a collar) after already being long the underlying during a large price increase. In this situation the long underlying leg will have large unrealised gains. A short risk reversal, allows us to safeguard some of those unrealised gains, without having to completely close our long position in the underlying.
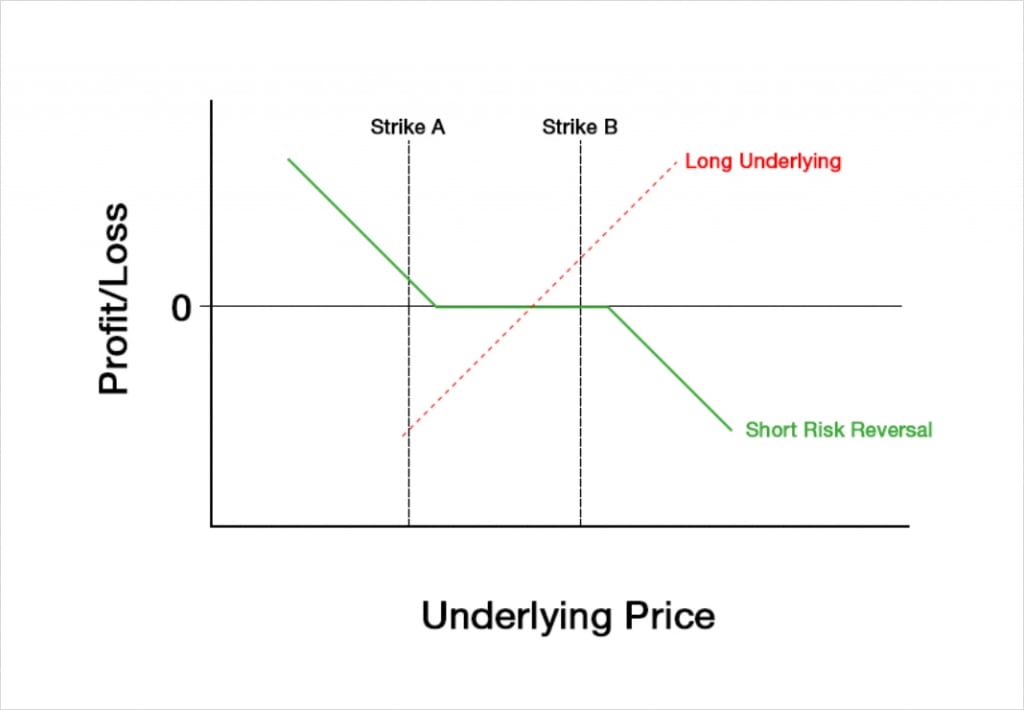
This chart shows the profit/loss of a profitable long position in the underlying, that has now used a short risk reversal to lock in some of the gains.
Due to the unrealised gains from the long underlying leg, we are able to guarantee at least some profit by purchasing a put option. By also selling the call option for roughly what we bought the put for, we can achieve this for close to zero cost. The real cost to this of course is that we are limiting any further gains if the underlying price increases beyond the strike of the call option that we have sold.
This may be an attractive strategy if we were long the underlying which has already increased in price significantly, and we are still moderately bullish but are now worried that the move may be running out of steam.
The Greeks
For the following sections on the PNL and the Greeks, we will focus on the values for a short risk reversal with a corresponding long position in the underlying, where we open all of the legs at once. We will use an underlying price that is precisely in the middle of strike A and strike B.
We will have two option strikes, but three legs in total, and we can sum the Greek values for each of these legs to get the total Greeks for our position.
To analyse how the Greeks behave we will use the following figures:
Underlying price: $100
Time to expiry: 50 days
Interest rate: 0
Implied volatility: 60%
Strike A: $90
Strike B: $110
These are our three legs:
+1 Underlying
+1 $90 put
-1 $110 call
Profit and loss
With these parameters the position will initially give us a credit of about $0.80. The payoff chart looks like this.
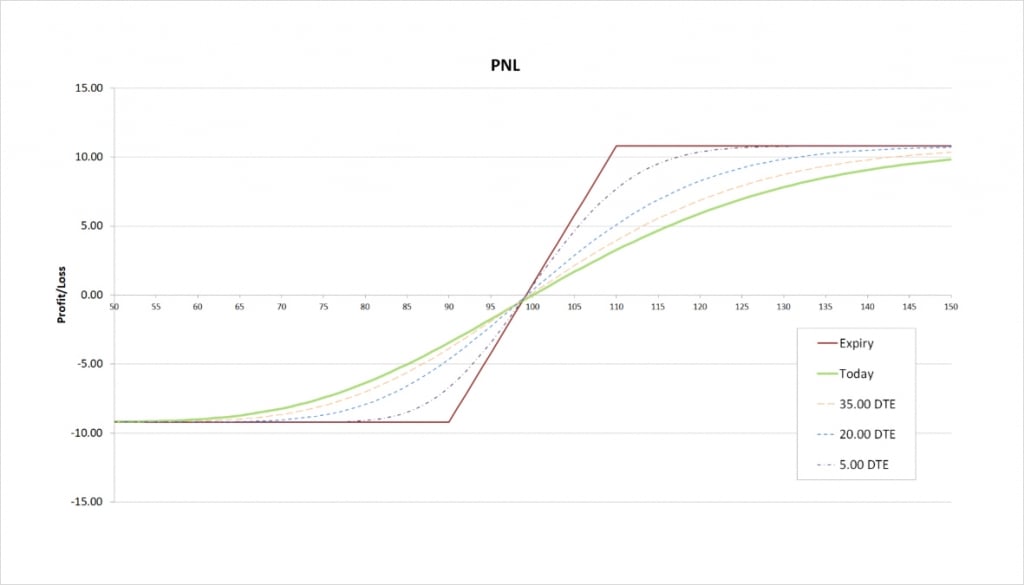
Between our strike prices of $90 and $110, we are essentially still long the underlying, except our profit/loss will be $0.80 higher due to the net credit received for the options. Once we get below our put strike of $90, our put ensures that our losses do not increase beyond this point. On the other hand once we get above our call strike of $110, our short call means that we no longer benefit from further price increases.
The maximum profit occurs when the underlying price is at or above our call strike of $110 at expiry. The maximum profit is capped by:
Maximum Profit = Strike B – Long Entry – Net Debit
= 110 – 100 – (-0.8)
= $10.80
The maximum loss occurs when the underlying price is at or below our put strike of $90 at expiry. The maximum loss is capped by:
Maximum Loss = Long Entry – Strike A + Net Debit
= 100 – 90 + (-0.8)
= $9.20
The breakeven point is calculated by adjusting the entry for our long position in the underlying by the amount we paid/received for the option. In this case we collected a credit of $0.80, so we subtract this from our long entry of $100 to get the breakeven point.
Breakeven = 100 – 0.80 = $99.20
Delta
We are short a call and long a put, both of which give us some negative delta. The amount of negative delta they are giving us depends on where the underlying price is. These two options alone give us this delta chart.
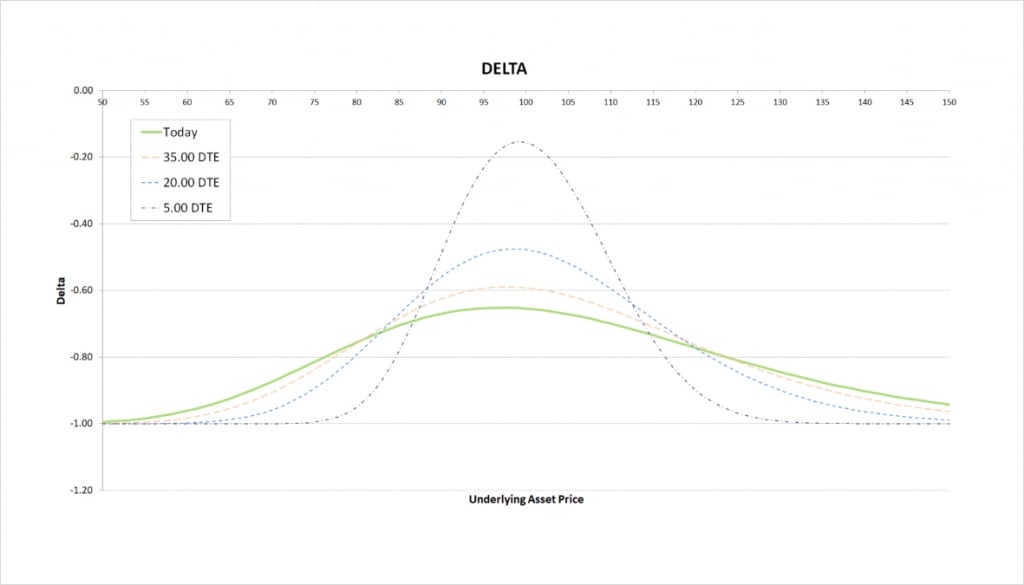
However, our long position in the underlying has a delta of 1 no matter where the underlying price is. This shifts the delta of our short risk reversal up by 1 at every point, giving our strategy this delta.
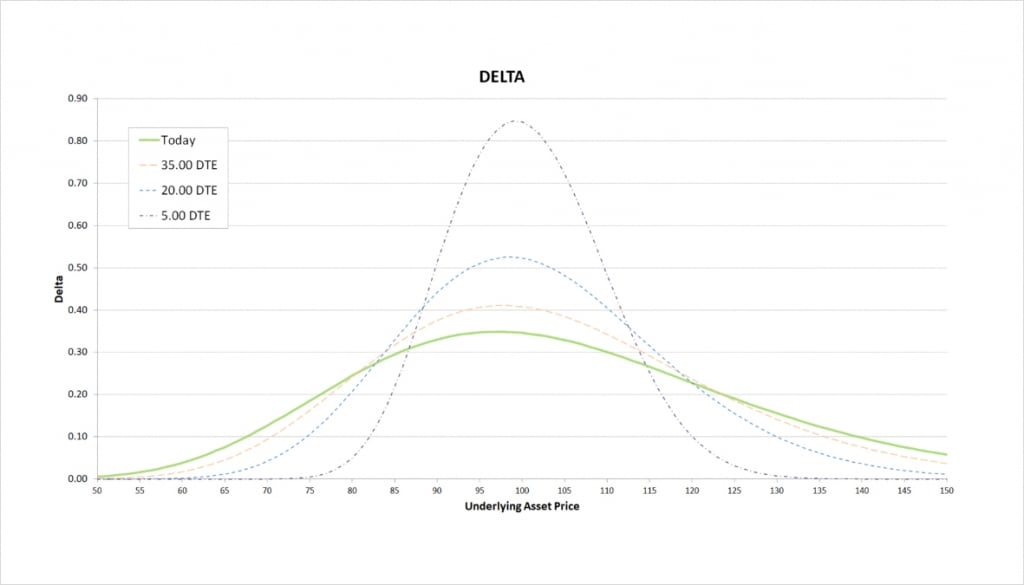
As with the profit/loss chart, the shape of the delta chart is very similar to that of a bull call spread or bull put spread. The delta peaks close to the middle of our two strikes, just below $100.
The delta of the options is always negative, but always smaller in magnitude than -1. As the delta of the underlying long is 1, this means our total delta is always between 0 and 1. As time passes, the peak delta gets closer to 1, and the price range where there is any significant delta reduces significantly.
As we get very close to expiry, either of our options will give us a delta approaching -1 when they are ITM, or a delta approaching 0 when they are OTM. (Remember we are short the call option, so it is also giving us a negative delta). Both options are OTM when the underlying price is between the strike prices of $90 and $110, so our total delta approaches 1 when the underlying price is in this range. The closer to the middle of this range the underlying price is, the sooner our total delta will get very close to 1. When the underlying price is outside of the $90 to $110 range, one of the options will be ITM, and therefore our total delta will approach zero when the underlying price is outside of the range. The further ITM one of the options is, the sooner our total delta will get very close to 0.
The delta of our long underlying plus short risk reversal then is always positive, and is highest when the underlying price is between the two strikes.
Gamma
Gamma is the rate of change of delta as the underlying price changes. In other words it tells us how steep the line is on the delta chart. As we just covered, the underlying long moved the entire delta line up on the y axis by a value of 1, but did not alter the shape or slope in any way. While the long position in the underlying does have a delta, it has no effect on any of the other Greeks, including gamma. So when we are looking at the gamma of our entire position, we are actually simply looking at the gamma of our two options, i.e. the risk reversal portion of our position.
As we move from left to right on the delta chart, whenever the delta is increasing, this means the gamma is positive. Whenever the delta is decreasing, this means the gamma is negative.
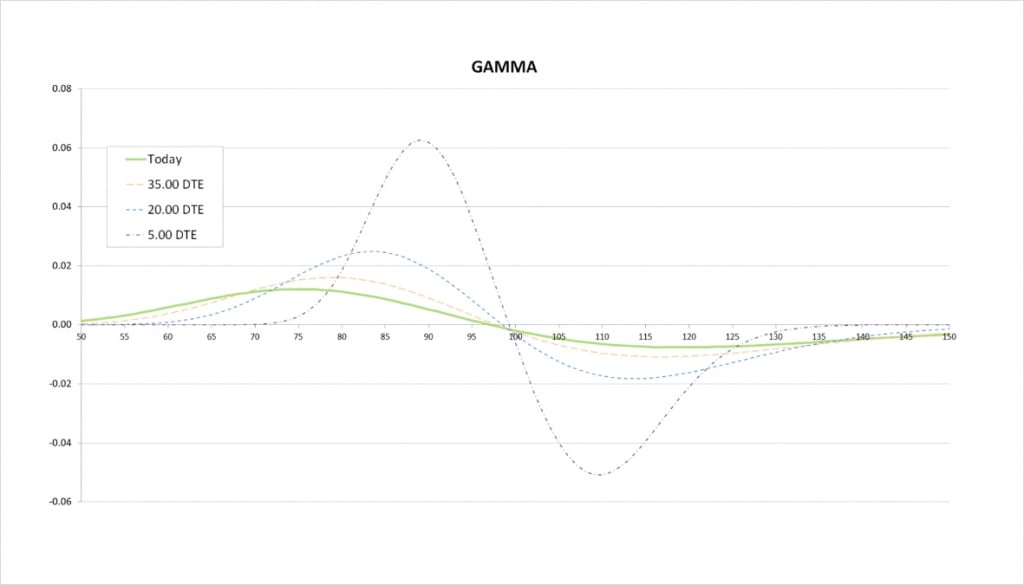
For the current values of delta with 50 days remaining until expiry, we see that delta increases slowly, peaks a little below $100, then decreases slowly. On the gamma chart this is shown by gamma starting positive, then crossing the x axis a little below $100, and then turning negative.
When we get much closer to expiry, the price range where there is any significant delta is much narrower, and delta changes much quicker. On the gamma chart this results in a narrower price range for significant gamma, and much more extreme values of gamma due to the more rapid changes in delta. The less time until the options expire, the closer the peaks in gamma are to our two strike prices of $90 and $110. We are long the $90 put, so we have positive gamma in this area. We are short the $110 call, so we have negative gamma in this area.
Vega
Vega tells us how an option’s value will change due to a change in implied volatility. We are long one option and short another here, so whether we have positive or negative total vega will depend on where the underlying price is relative to our strike prices.
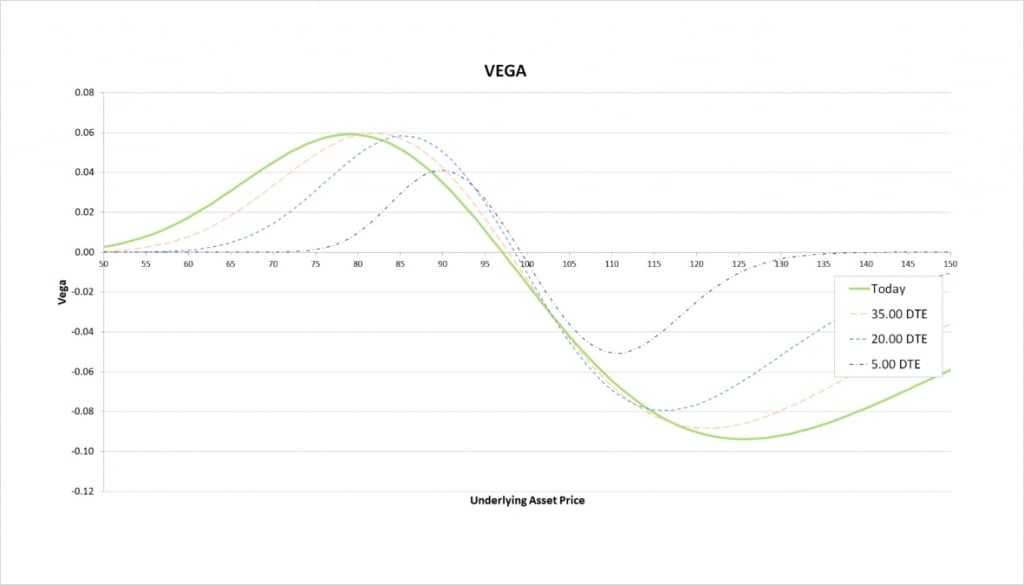
We are long the $90 put which gives us some positive vega, and we are short the $110 call which gives us some negative delta. Remember vega is highest when an option is close to the money. To the left of the chart, we can see that because the $90 put is closer to the money, the positive vega we gain from this option outweighs the negative vega from being short the $110 call.
As we move to the point where the underlying price is close to the middle of both strikes, their vegas largely cancel each other out, giving us a very small vega value. The precise point where vega is zero varies a little depending on how much time is left until the options expire.
Once we get to the right side of the chart, with the underlying price above both strikes, the $110 strike is closer to the money. This leads to the negative vega of the short $110 call outweighing the smaller positive vega we have from the $90 put. The total vega is therefore negative here.
The less time is left until the options expire, the closer the underlying price has to be to one of our strike prices for the position to have any significant vega.
Theta
Theta tells us the rate an option is currently losing value as time passes. We are long a put and short a call, so we will always have one option giving us negative theta and one giving us positive theta. Remember the long underlying leg has an effect on the delta, but it has no effect on the other Greeks like theta. So when we look at the theta of our whole position, we are actually just looking at the theta of the two options.
The magnitude of an option’s theta will depend where the underlying price currently is relative to the strike price of each option, with options that are close to the money typically having the greatest theta. So, whether our short risk reversal has negative or positive theta depends on where the underlying price is relative to the strikes.
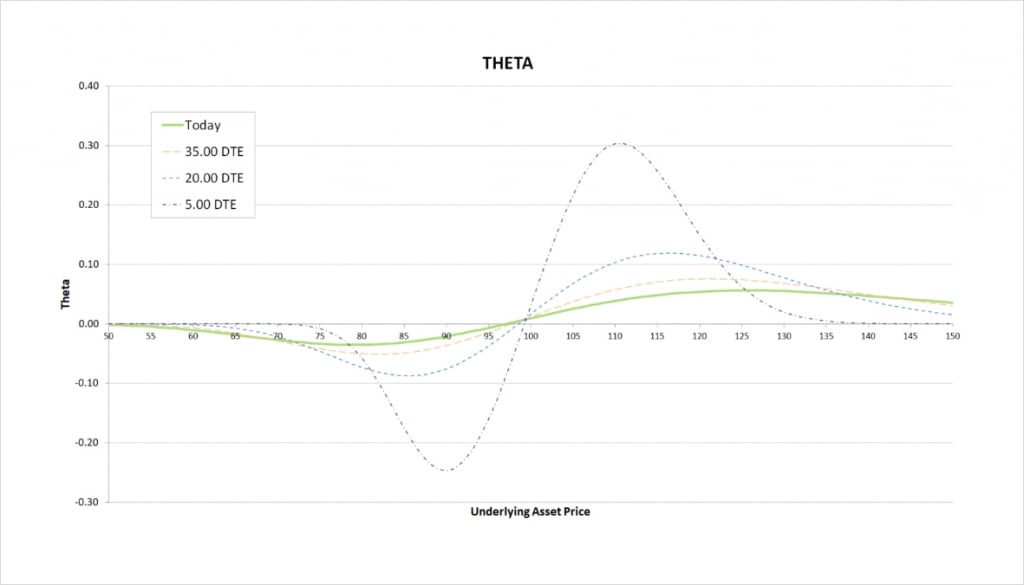
To the left of the chart, we can see that because the $90 put is closer to the money, the negative theta we have from this option outweighs the positive theta from the $110 call.
As we move to the point where the underlying price is in between our two strikes, their thetas largely cancel each other out, giving the short risk reversal a very small theta value.
Once we get to the right side of the chart, with the underlying price above both strikes, the $110 strike is closer to the money. This leads to the positive theta of the $110 strike outweighing the smaller negative theta we have from the $90 strike. The theta of the short risk reversal is therefore positive here.
The less time is left until the options expire, the closer the underlying price has to be to one of our strike prices for the position to have any significant theta. As we come into expiry, if the underlying price is close to our put strike of $90, we have increasingly negative theta. If instead the underlying price is close to our call strike of $110, we have increasingly positive theta.
Inverse option contracts
A risk reversal (or short risk reversal here) using the inverse contracts on Deribit is constructed in the same way as with the linear options we have been discussing so far. We purchase an OTM put, and sell an OTM call.
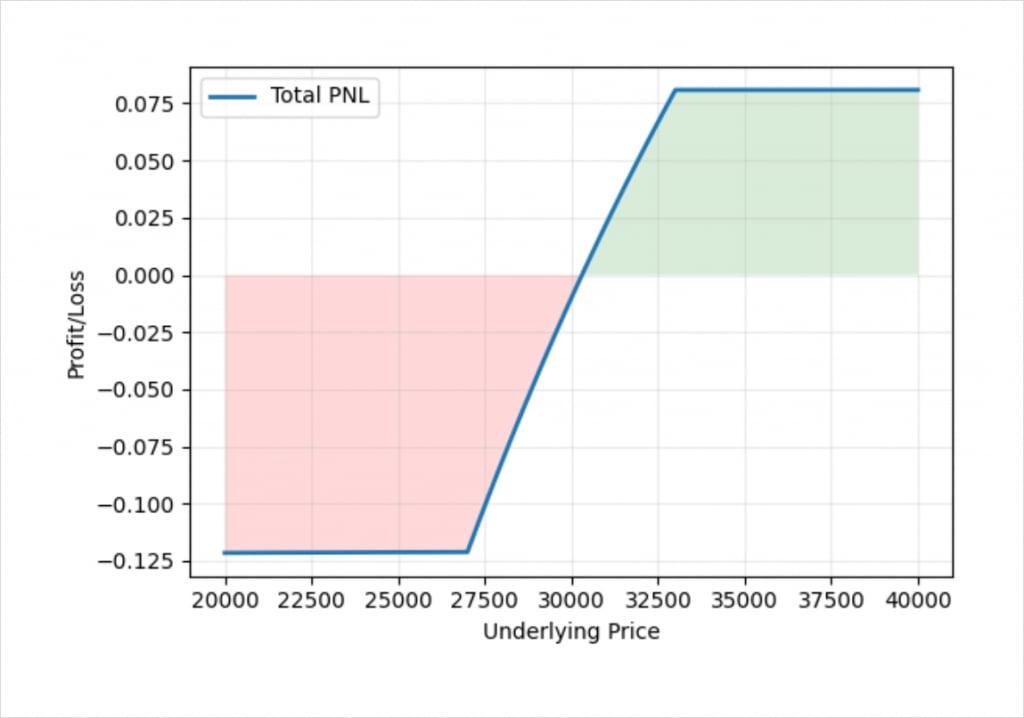
This chart shows the bitcoin payoff at expiry of a short risk reversal (with no underlying long) using the bitcoin options on Deribit. In this example we have assumed the underlying price of bitcoin is $30,000, and used the following strikes:
+1 $27,000 put
-1 $33,000 call
And we have assumed that we manage to establish this position for zero cost.
Apart from the usual curve to the line that we get when using inverse contracts, this chart looks very similar to the equivalent chart of a short risk reversal with linear contracts.
We can also combine this with a position in the underlying. For this example, we will assume that we have longed the inverse bitcoin perpetual contract as well, with an entry price of $30,000. If we do this we get a payoff like this.
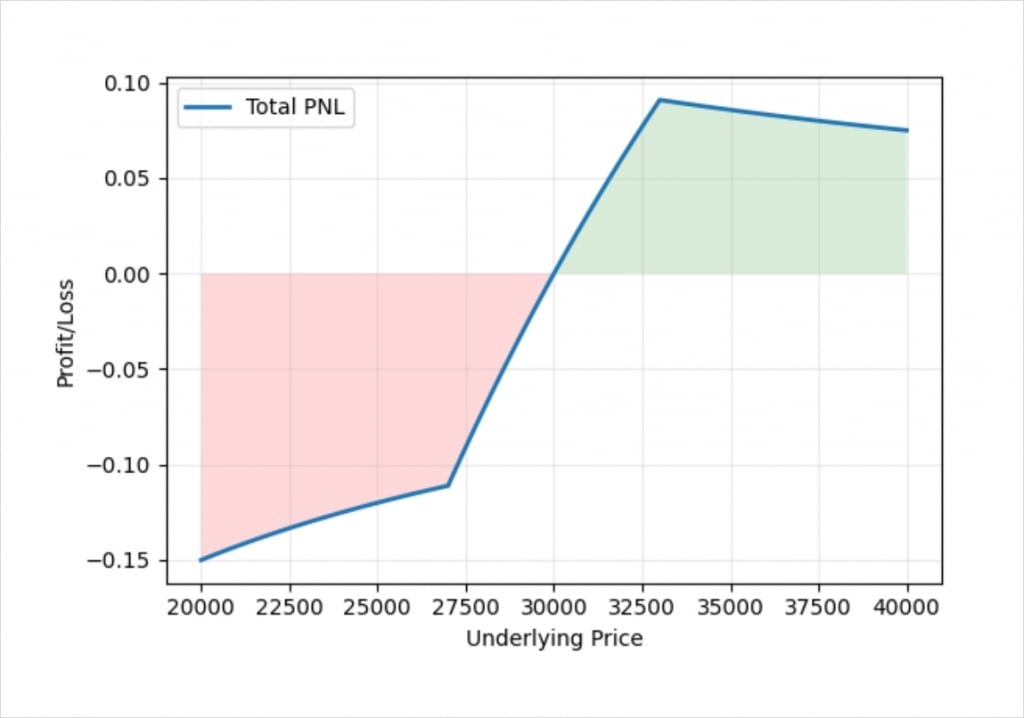
This results in a similar payoff to a bull vertical spread, but is a little wonky due to the inverse contracts. By adjusting the position sizes it’s possible to flatten off the chart in base currency terms as well as we have done in previous lectures.
This gives us a payoff just like a bull vertical spread where we have capped the maximum profit and loss in bitcoin terms rather than dollar terms.
Risk reversals
Risk reversals (or collars) can be executed by themselves with just options, but are also commonly used to hedge a position in the underlying. A common use is adding a short risk reversal (aka a collar) to a long position in the underlying that is already in profit. Doing so locks in some of the unrealised gains without having to close the underlying long position.
Depending on which direction the trade is in, a risk reversal will have a delta that is either always positive or always negative. However, the gamma, vega and theta all depend on where the underlying price is relative to the underlying price.