

In this lecture we will be looking at butterfly structures. We will show how to construct a butterfly with puts, with calls, or as an iron butterfly with both puts and calls.
A butterfly strategy is similar to a condor strategy, except we are speculating on a much narrower price range, and indeed the maximum profit is only possible at one specific price rather than a price range. As with the condors we looked at in the previous lecture, there are a few ways to construct a butterfly position, but the resulting payoff is so similar that we’re going to look at them all together in this lecture.
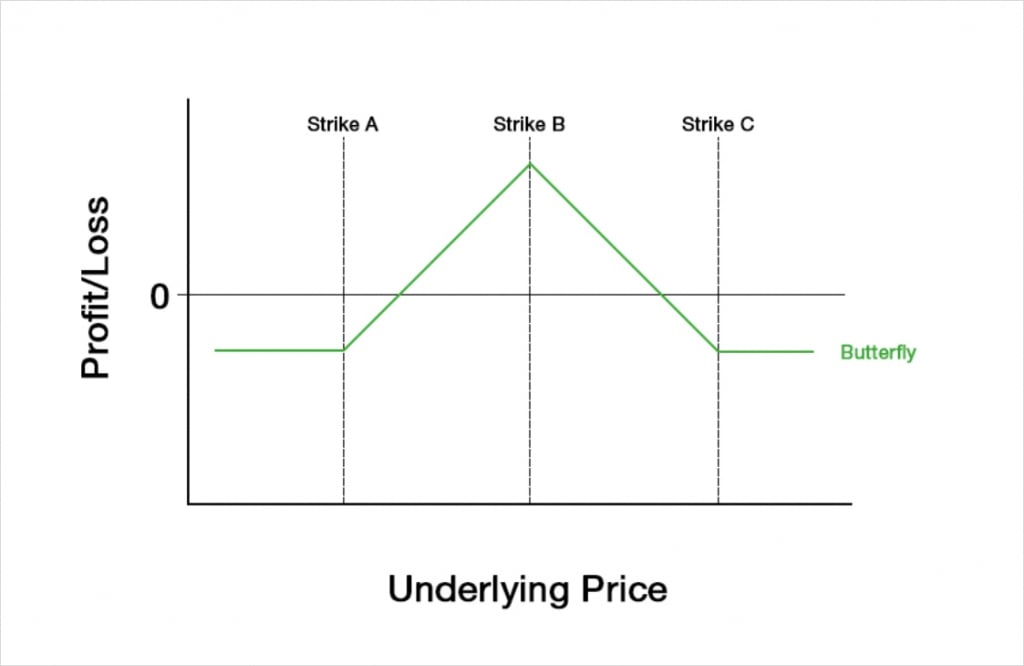
Just like with a condor, a butterfly is a fixed risk structure, and we are speculating on the underlying price remaining in a certain place, but with a butterfly we want it to be specifically at, or at least very close to, strike B at expiry.
It is of course possible to take the opposite position, and speculate that the underlying price will not end up near strike B. However, as it is more common to use a butterfly to speculate on the price getting close to strike B, we will only be discussing this side of the trade for this lecture. For the other side of the trade, we can just multiply everything by -1, which flips the PNL and Greeks around the x axis.
If a butterfly is executed when the underlying price is somewhere close to strike B, then it works a lot like a fixed risk version of a short straddle. Compared to a short straddle, a smaller credit will be collected, but the potential losses are limited. When the underlying price is close to strike B, a butterfly will be neutral on price direction. It will also be bearish on volatility, as with the underlying price in the perfect place already, we want it to move as little as possible.
A butterfly with calls is constructed by:
-Purchasing a call with a strike price of A
-Selling two calls with a strike price of B
-Purchasing a call with a strike price of C
To construct the same butterfly with puts, this instead involves:
-Purchasing a put with a strike price of A
-Selling two puts with a strike price of B
-Purchasing a put with a strike price of C
And finally, to construct an iron butterfly, which uses both puts and calls, this is done by:
-Purchasing a put with a strike price of A
-Selling a put with a strike price of B
-Selling a call with a strike price of B
-Purchasing a call with a strike price of C
In each case, for a butterfly the distance between A and B is the same as the distance between B and C. If these distances are different, it would create what’s known as a skip strike butterfly or broken wing butterfly.
As options that are OTM will typically have the best liquidity, an iron butterfly is most likely to be easiest to execute for the best price when the underlying price is very close to strike B. The butterfly with calls will likely be best when the underlying price is below all the strikes, because all of the calls will be OTM. Similarly, the butterfly with puts will likely be best when the underlying price is above all the strikes, because all of the puts will be OTM.
In all three versions, the butterfly is the equivalent of two vertical spreads. For example:
-A butterfly with calls is the equivalent of a bull call spread (with strikes A and B) plus a bear call spread (with strikes B and C).
-A butterfly with puts is the equivalent of a bull put spread (with strikes A and B) plus a bear put spread (with strikes B and C).
-An iron butterfly is the equivalent of a bull put spread (with strikes A and B) and a bear call spread (with strikes B and C).
An iron butterfly could instead be broken up into a short straddle with a strike price of B and a long strangle with strikes of A and C.
It is possible then to leg into a butterfly strategy by executing each of the spreads that it is composed of separately. Hopefully by now it is also becoming clear that many of the multi-leg option positions we are discussing in this section overlap with each other, and it is possible to express a view on the market in more than one way.
Butterflies with only calls or only puts will be established for a net debit. The maximum loss for these butterflies is limited to the net debit paid to establish the position. If it were possible to establish it for a net credit, it would represent an arbitrage opportunity.
The maximum profit for a call butterfly is limited to:
Maximum Profit = Strike B – Strike A – Net Debit
The maximum profit for a put butterfly is limited to:
Maximum Profit = Strike C – Strike B – Net Debit
Though when the strikes are evenly spaced (and therefore C – B = B – A), these two formulas will give the same result.
An iron butterfly on the other hand, will be established for a net credit. The maximum profit of the iron butterfly is limited to the credit collected. The maximum loss of the iron butterfly is:
Maximum Loss = Strike B – Strike A – Net Credit
All three versions of a butterfly are fixed risk, fixed reward structures.
The butterflies that are established for a net debit have the following breakeven points:
First Breakeven = Strike A + Debit
Second Breakeven = Strike C – Debit
Iron butterflies, which are established for a net credit have the following breakeven points:
First Breakeven = Strike price B – Credit
Second Breakeven = Strike price B + Credit
The Greeks
For the following sections on the PNL and the Greeks, we will focus on the values for an iron butterfly. We will use an initial underlying price of strike B, and therefore an ATM put and an OTM put combined with an ATM call and an OTM call to create the desired structure.
We will have three strikes and four legs in total, and we can sum the Greek values for each of these legs to get the total Greeks for the iron butterfly.
To analyse how the Greeks behave we will use the following figures:
Underlying price: $100
Time to expiry: 50 days
Interest rate: 0
Implied volatility: 60%
Strike A: $90
Strike B: $100
Strike C: $110
For clarity, this is our position:
+1 $90 put
-1 $100 put
-1 $100 call
+1 $110 call
Profit and loss
With these parameters the $90/$100/$110 iron butterfly will initially give us a credit of about $8.24. The payoff chart looks like this.
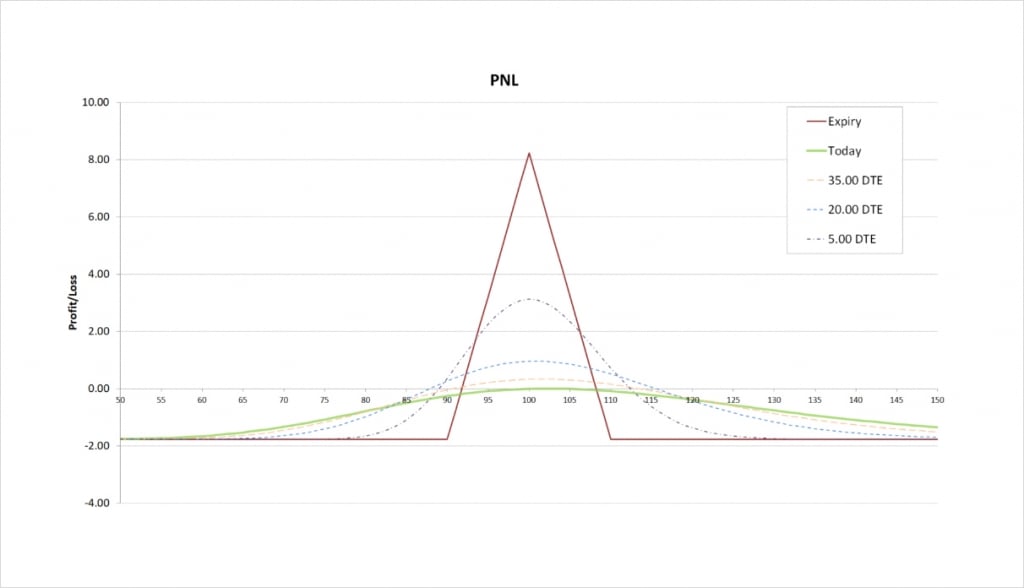
The maximum profit is capped at net credit received, which is $8.24. This maximum profit occurs when the underlying price is precisely at strike B at expiry.
The maximum loss is capped by:
= Strike B – Strike A – Net Credit
= 100 – 90 – 8.24
= $1.76
This maximum loss occurs when the underlying price is outside of all of our chosen strikes at expiry. So if the underlying price is either below $90 or above $110 at expiry, we will suffer the maximum possible loss of $1.76. No matter how far the price moves outside of our chosen range, we can only lose $1.76 at most.
You may have noticed the attractive risk/reward ratio, with a maximum of $1.76 being risked for a maximum payout of $8.24. It is also possible to construct butterflies with even higher ratios than this. Be wary of putting too much emphasis on this specific figure with butterflies though, because the maximum reward only happens at one specific price, and is therefore very unlikely to happen, even if you do hold the position to expiry.
There are two breakeven points. As we have an iron butterfly, we initially collected a net credit, and our breakeven points can be calculated as follows.
First Breakeven:
= Strike price B – Credit
= 100 – 8.24
= $91.76
Second Breakeven:
= Strike price B + Credit
= 100 + 8.24
= $108.24
As usual, the trader on the other side of the trade will have the same breakeven points. This is ignoring any fees, and assuming they are on the other side of all the legs involved in the strategy.
Delta
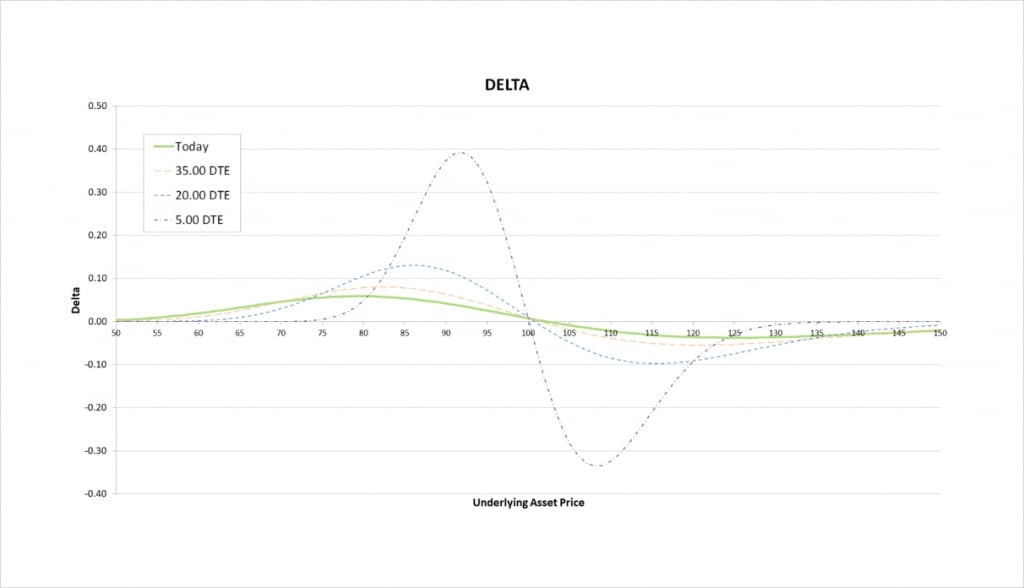
Our iron butterfly can have either a positive or negative delta. The sign of the delta depends on where the underlying price is relative to the strikes.
This chart shows the delta of the iron butterfly, with the x axis being the underlying price. The extra lines also show how the delta will evolve as time passes.
If you’ve just been through the previous lecture, you may notice that the shape of the delta chart is very similar to the delta chart of the iron condor we looked at in that lecture.
When the underlying price is below all of our strikes, the delta is positive. When the only place our position can make a profit at expiry is above the current price, it makes sense that our position will increase in value when the underlying price increases, so our delta is positive.
When the underlying price is close to strike B of our iron butterfly, at $100, the delta is very close to zero. With the underlying price already in the perfect place for our symmetrical position, it doesn’t matter too much which direction price moves, as long as it doesn’t move too much.
When the underlying price is above all of our strikes, the delta is negative. When the only place our position can make a profit at expiry is below the current price, it makes sense that our position will decrease in value when the underlying price increases, so our delta is negative.
As time passes the price range where there is any significant delta narrows, and the peaks increase in magnitude. The general shape however remains the same, where we have a positive peak towards the lower end of our strikes and a negative peak towards the upper end of our strikes.
Gamma
As we move from left to right on the delta chart, whenever the delta is increasing, this means the gamma is positive. Whenever the delta is decreasing, this means the gamma is negative.
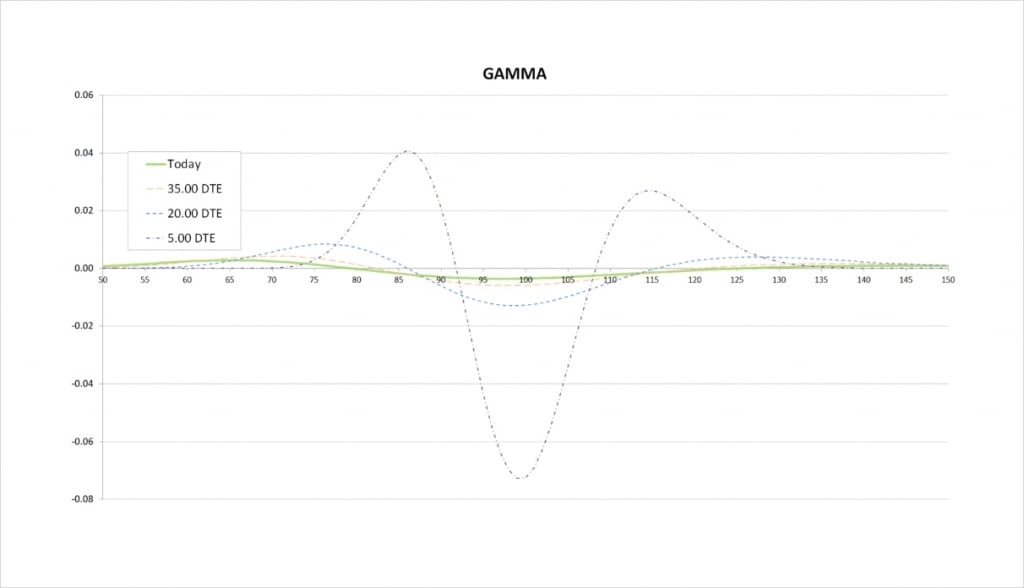
For the current values of delta with 50 days remaining until expiry, we see that delta increases slowly, peaking at around $80. It then decreases until the underlying price gets to about $125. On the gamma chart this is shown by starting positive, and crossing the x axis at about the $80 mark where delta peaks. Gamma is then negative while the delta is decreasing. Gamma crosses back into positive at about the $125 mark as the delta begins to increase again.
It’s worth noting that at least initially, the delta changes are small, and therefore the gamma is small, no matter where the underlying price is. It is only as we get closer to expiry when we see the butterfly pick up more delta and gamma if we are still close to our strikes
As time passes the price range where we have any significant gamma narrows, and the magnitude of gamma increases. The peaks of gamma get closer and closer to our strike prices.
We are long the $90 put and the $110 call, so both of these options give us positive gamma, and we have positive peaks in gamma at these strikes. We are short the $100 put and the $100 call, so both of these options give us negative gamma, and we have a larger negative peak in gamma at the $100 strike.
Vega
We are long some options and short others, so the sign of our vega depends on where the underlying price is sitting relative to our chosen strikes.
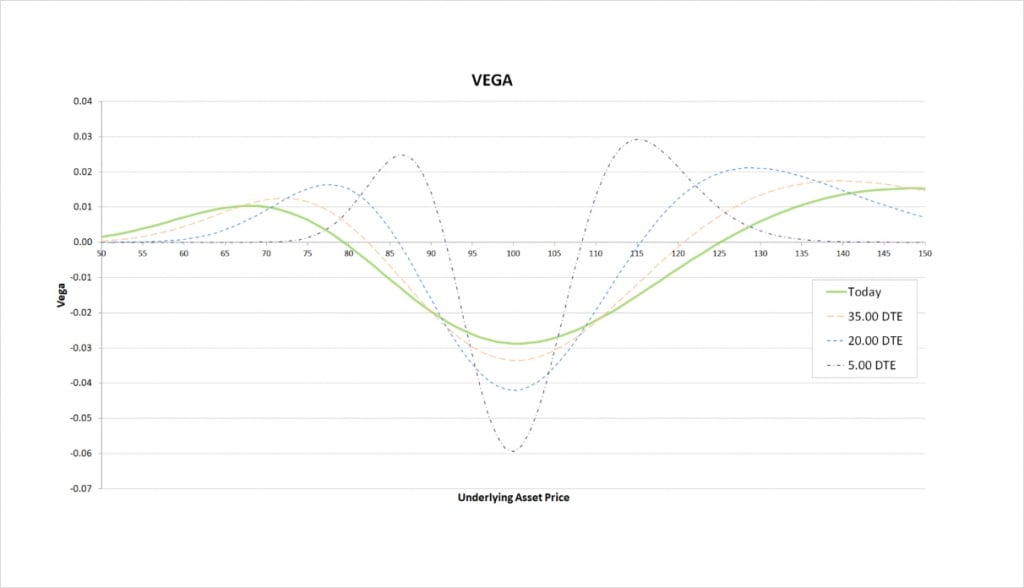
At expiry, our position makes a profit when the underlying price is close to our short strike of $100, so while the underlying price is already sitting somewhere close to $100, we want the price to move as little as possible. An increase in volatility would hurt our position, so we have negative vega in the centre of the chart here.
While the underlying price is outside of our range of strikes, we need the underlying price to move, so an increase in volatility helps our position. We therefore have positive vega at either side of this vega chart.
As time passes the shape of the vega profile stays roughly the same, but with the price range where we have significant vega decreasing, and vega becoming increasingly concentrated around our strike prices.
Theta
We are long two options that give us some negative theta, and short two other options which give us some positive theta. Whether our iron butterfly has negative or positive theta depends on where the underlying price is relative to the strikes.
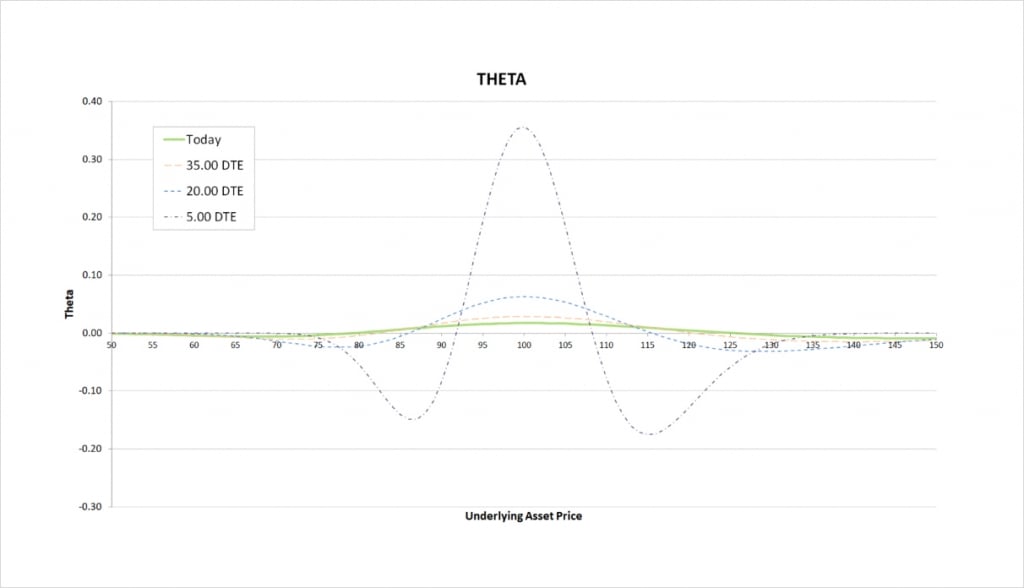
Our position makes a profit when the underlying price is close to our short strike of $100. While the underlying price is already sitting somewhere close to $100, time passing without price moving helps our position. We gain as time passes so we have positive theta here.
While the underlying price is outside of our range of strikes, we need the underlying price to move, so the passage of time without price movement hurts our position. We therefore have negative theta when the underlying price is sitting way outside of our range of strikes.
As time passes the same is still true, but the price range where we have significant theta decreases, theta becomes increasingly concentrated around our strike prices, and the magnitude of theta increases significantly.
Inverse option contracts
Our iron butterfly is a combination of a bull put spread and a bear call spread, where the short strike of each is the same. We can do the same when constructing an iron butterfly using the inverse option contracts on Deribit.
This chart shows the bitcoin payoff at expiry of an iron butterfly using the bitcoin options on Deribit. In this example we have assumed the underlying price of bitcoin is $30,000, and used the following strikes:
+1 $26,000 put
-1 $30,000 put
-1 $30,000 call
+1 $34,000 call
And we have assumed that we collected a net credit of 0.1 BTC for the iron butterfly.
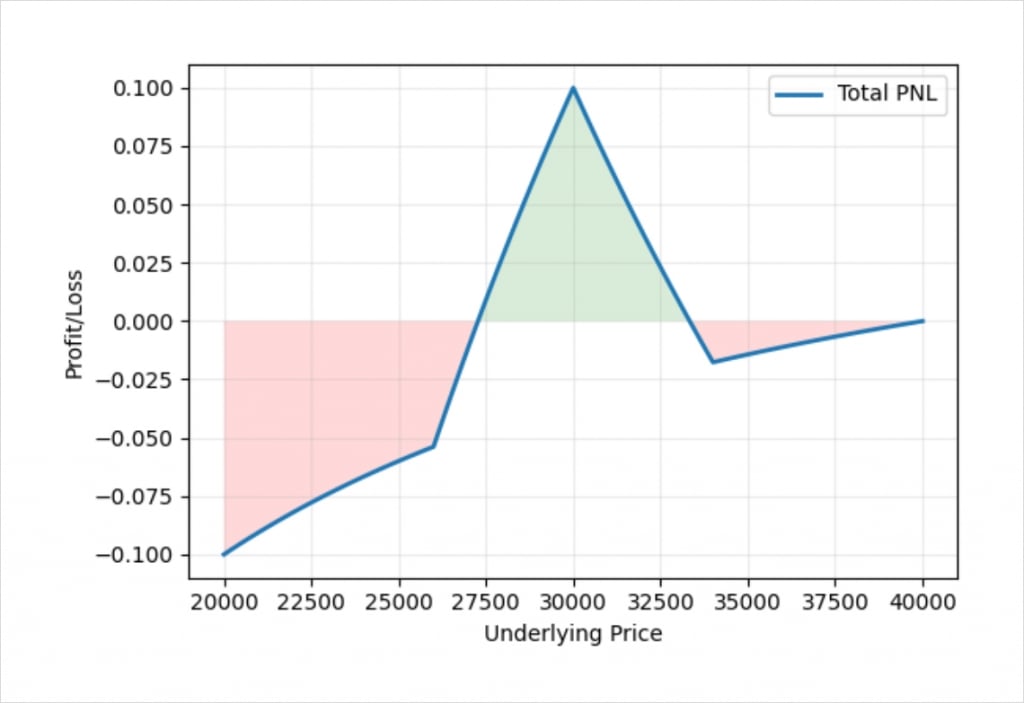
The middle of the chart where we make a profit is very similar to the profit/loss chart we saw earlier for the dollar example. On either side though we see the familiar curve that we get from using inverse contracts. The vertical spread on each side of our iron butterfly has a fixed width measured in dollars. The maximum amount one of the vertical spreads can be worth if the price is outside of our chosen range at expiry is this fixed amount of dollars, but how much bitcoin it takes us to pay this amount of dollars depends on what the price of bitcoin is.
If we are more concerned about our bitcoin balance than our dollar balance, we may want the spread to be more symmetrical in bitcoin terms. Thankfully this can be achieved by using the method we discussed previously in this section of the course.
We just need to adjust the position sizes of each leg of the two vertical spreads. For example, if we execute the iron butterfly with the ratio:
+1.5 $26,000 put
-1.3 $30,000 put
-1.7 $30,000 call
+1.5 $34,000 call
We get the following profit/loss chart:
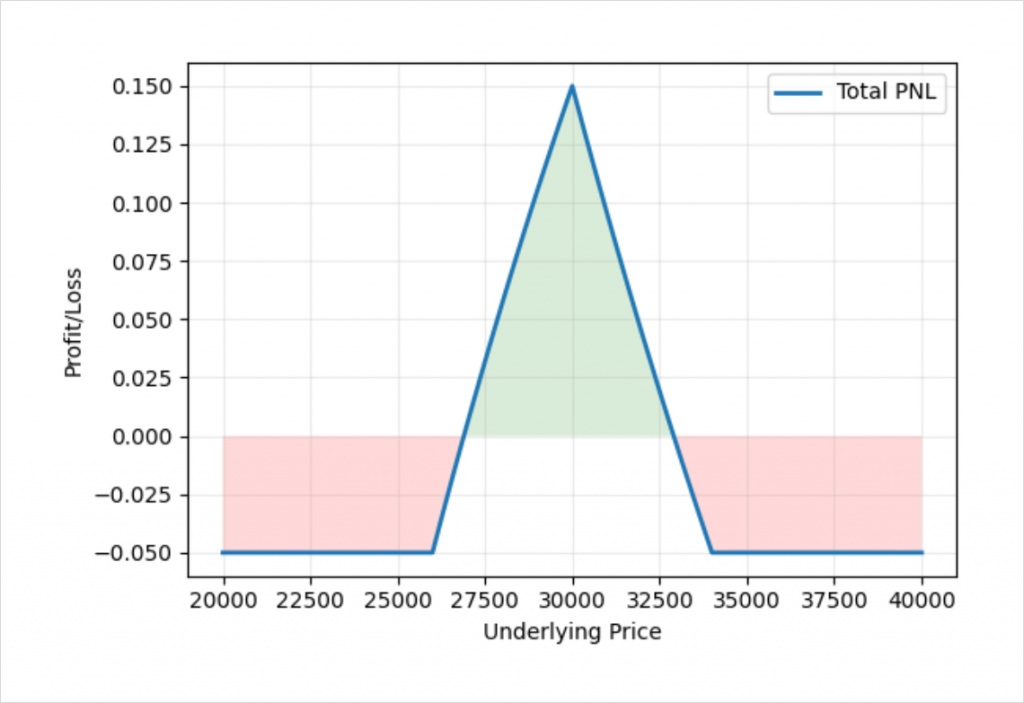
If we look at each vertical spread separately, then size each leg to be proportional to the other leg in the vertical spread, we get a ratio of 30/26/34/30. Any multiple of this will produce the same payoff shape.
When using only calls or only puts to construct a butterfly we can avoid this complication by simply using a 1/1/1/1 ratio. Note that the 1/1/1/1 ratio does not produce a flat risk in base currency terms for an iron butterfly, but it does for a call butterfly or put butterfly. The reason for this is that for the call butterfly and put butterfly, the maximum risk is limited to the net debit we initially pay to establish the position, which is paid in the base currency. If the underlying price is outside of the range of strikes at expiry, the value of the position is simply zero and we have nothing more to pay. Whereas with the iron butterfly, we initially collect a credit, and if the underlying price is outside of the range of strikes at expiry, one of the vertical spreads that we are short will have a value that we need to pay out. This value is fixed in dollar terms, but variable in bitcoin terms, resulting in the curved payoff we observed earlier.
As always, it’s a good idea to have a play around in some type of position builder to gain a better understanding of how things work. Deribit has a position builder that pulls in live prices from the exchange. That can be found here.
Alternatively I’ve written some Python code that handles both linear and inverse contracts, which you can find here.
Butterflies
Whether constructed with puts, calls, or both, butterflies offer traders a way to speculate on the underlying price staying close to a specific price. A butterfly strategy also benefits from having a fixed risk, though care should be taken when using inverse contracts to understand whether your risk is fixed in dollars or the base currency (such as bitcoin). This fixed risk does come at a cost, as the maximum profit of a butterfly will be less than the corresponding straddle, which would be the undefined risk version of this type of strategy.