

In this lecture we will be looking at condors. We will show how to construct a condor with puts, with calls, or as an iron condor with both puts and calls.
Although there are a few ways to construct a condor position, the resulting payoff is so similar that we’re going to look at them all together in this lecture. No matter how it’s constructed it’s easy to understand the general aim of a condor by simply looking at the profit/loss chart.
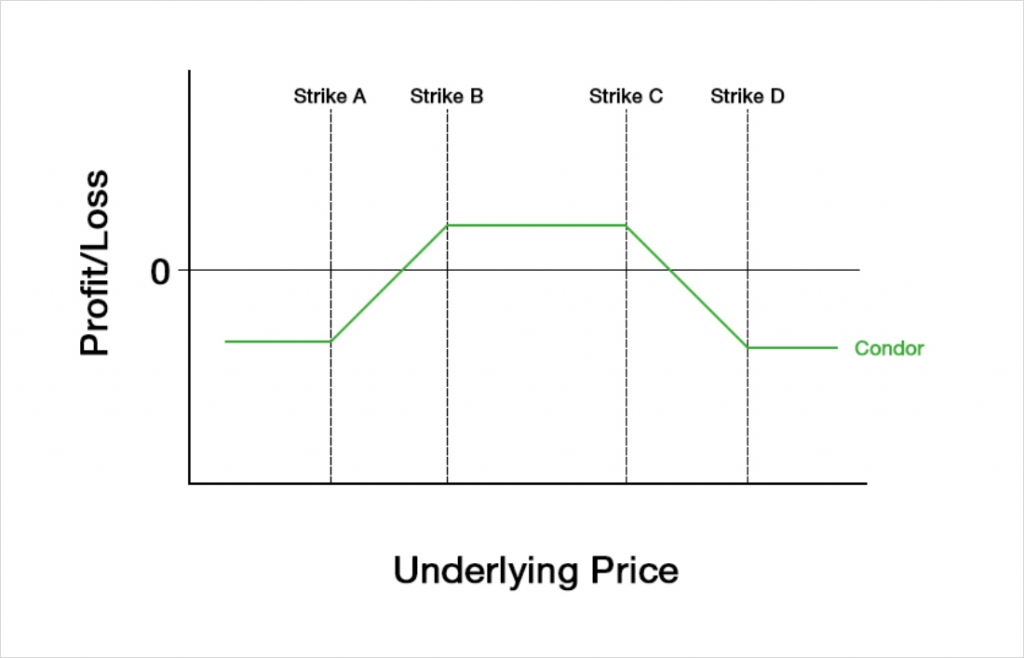
When we construct a condor position with a payoff like this, clearly we want the underlying price to be between strikes B and C at expiry. So we are speculating that the underlying price will remain range bound, and we are doing so with a fixed risk structure.
It is of course possible to take the opposite position, and speculate that the underlying price will end up outside of the range, however condors are usually constructed to speculate on range bound price action, so we will only be discussing this side of the trade for this lecture. As always though, if you want to know what the other side of the trade looks like, just multiply everything by -1, which flips the PNL and Greeks around the x axis.
A condor is usually executed with the underlying price between strikes B and C, and will have a small delta close to zero when this is the case. This means the strategy will initially be roughly neutral on price direction. It will also be bearish on volatility, as we want the underlying price to move as little as possible.
A condor with calls is constructed by:
-Purchasing a call option with a strike price of A
-Selling a call option with a strike price of B
-Selling a call option with a strike price of C
-Purchasing a call option with a strike price of D
To construct the same condor with puts, this instead involves:
-Purchasing a put option with a strike price of A
-Selling a put option with a strike price of B
-Selling a put option with a strike price of C
-Purchasing a put option with a strike price of D
And finally to construct an iron condor, which uses both puts and calls, this is done by:
-Purchasing a put option with a strike price of A
-Selling a put option with a strike price of B
-Selling a call option with a strike price of C
-Purchasing a call option with a strike price of D
In all three versions, the condor is the equivalent of two vertical spreads. For example, if the underlying price is between B and C:
-A condor with calls is the equivalent of an ITM bull call spread (with strikes A and B) and an OTM bear call spread (with strikes C and D).
-A condor with puts is the equivalent of an OTM bull put spread (with strikes A and B) and an ITM bear put spread (with strikes C and D).
-An iron condor is the equivalent of an OTM bull put spread (with strikes A and B) and an OTM bear call spread (with strikes C and D).
It is possible then to leg into a condor by executing each of the vertical spreads that it is composed of separately. In all versions the distance between A and B, and the distance between C and D will be the same, however the distance between B and C is often different.
Condors with only calls or only puts will be established for a net debit. The maximum loss for these condors is limited to the net debit paid to establish the position. The maximum profit for these condors is limited to:
Maximum Profit = Strike B – Strike A – Net Debit
On the other hand, an iron condor will be established for a net credit. The maximum profit of the iron condor is limited to the credit collected. The maximum loss for the iron condor is:
Maximum Loss = Strike B – Strike A – Net Credit
Condors are fixed risk, fixed reward structures.
The condors that are established for a debit have the following breakeven points:
First Breakeven = Strike price A + Debit
Second Breakeven = Strike price D – Debit
Iron condors, which are established for a net credit have the following breakeven points:
First Breakeven = Strike price B – Credit
Second Breakeven = Strike price C + Credit
Due to the better liquidity in OTM options, it will usually be easiest to place a condor using whichever options are OTM. When the underlying price is somewhere between strikes B and C, this will result in us executing an iron condor by selling both an OTM put spread and an OTM call spread.
The Greeks
For the following sections on the PNL and the Greeks, we will focus on the values for an iron condor. We will use OTM puts and OTM calls to create the desired structure, with the underlying price being between the put spread and call spread that will make up our iron condor.
We will have four strikes in total, and we can sum the Greek values for each of these legs to get the total Greeks for the iron condor.
To analyse how the Greeks behave we will use the following figures:
Underlying price: $100
Time to expiry: 50 days
Interest rate: 0
Implied volatility: 60%
Strike A: $80
Strike B: $85
Strike C: $115
Strike D: $120
For clarity, this is our position:
+1 $80 put
-1 $85 put
-1 $115 call
+1 $120 call
Profit and loss
With these parameters the $80/$85/$115/$120 iron condor will initially give us a credit of about $2.14. The payoff chart looks like this.
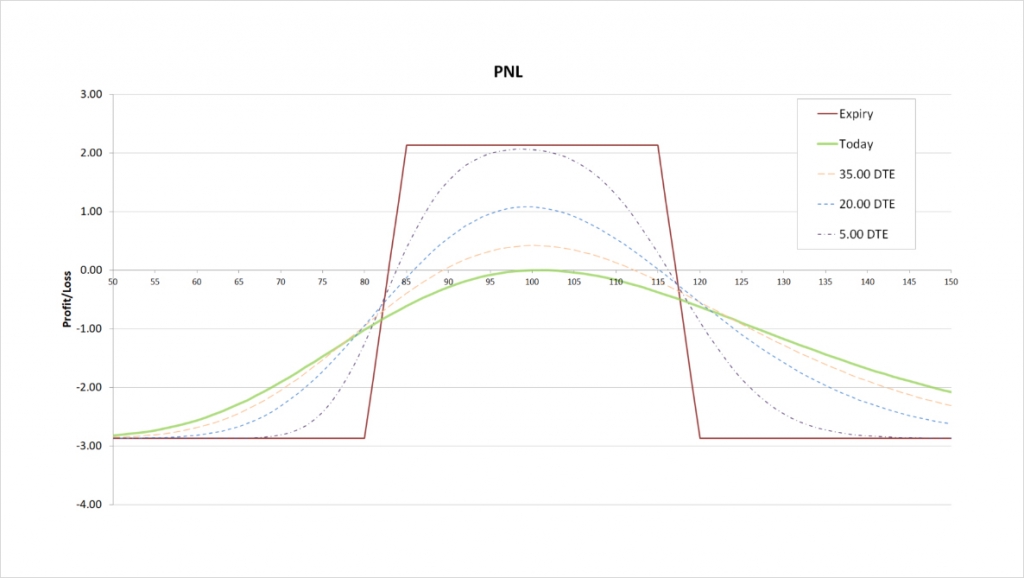
The maximum profit is capped at the net credit received, which is $2.14. This maximum profit occurs when the underlying price is between strikes B and C, so between $85 and $115.
The maximum loss is capped by:
= Strike B – Strike A – Net Credit
= 85 – 80 – 2.14
= $2.86
This maximum loss occurs when the underlying price is outside of all of our chosen strikes at expiry. So if the underlying price is either below $80 or above $120 at expiry, we will suffer the maximum possible loss of $2.86. No matter how far the price moves outside of our chosen range, we can only lose $2.86 at most. This fixed risk is the most appealing property of a condor position.
There are two breakeven points. As we have an iron condor, we initially collected a net credit, and our breakeven points can be calculated as follows.
First Breakeven:
= Strike price B – Credit
= 85 – 2.14
= $82.86
Second Breakeven:
= Strike price C + Credit
= 115 + 2.14
= $117.14
As usual, the trader on the other side of the trade will have the same breakeven points. This is ignoring any fees, and assuming they are on the other side of all the legs involved in the strategy.
Delta
Our iron condor can have either a positive or negative delta. The sign of the delta depends on where the underlying price is relative to the strikes.
This chart shows the delta of the iron condor, with the x axis being the underlying price. The extra lines also show how the delta will evolve as time passes.
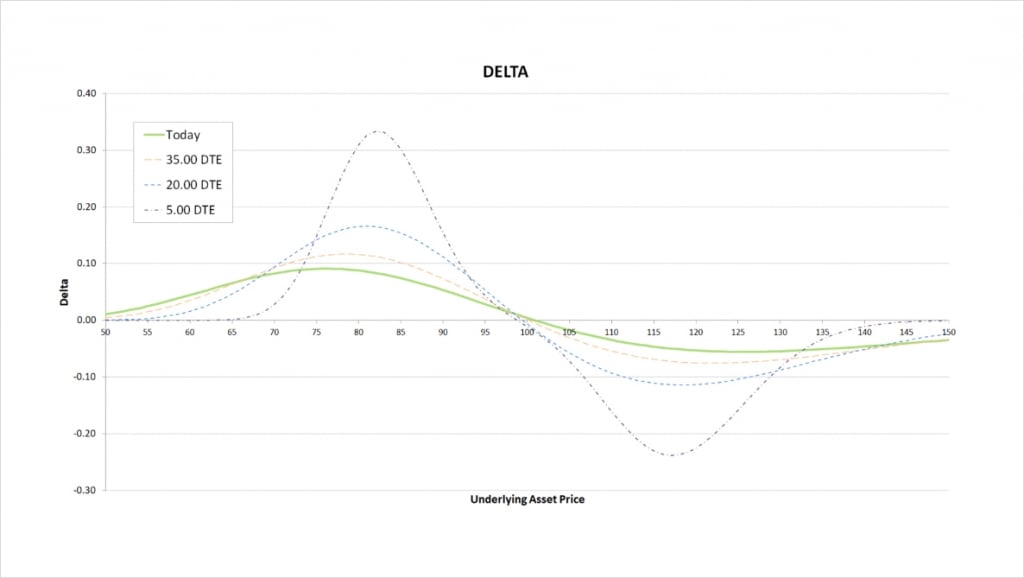
When the underlying price is below all of our strikes, the delta is positive. When the only place our position can make a profit at expiry is above the current price, it makes sense that our position will increase in value when the underlying price increases, giving us a positive delta.
When the underlying price is close to the middle of our iron condor, at roughly $100, the delta is very close to zero. With the underlying price already in the perfect place for our symmetrical position, it doesn’t matter too much which direction price moves, as long as it doesn’t move too much.
When the underlying price is above all of our strikes, the delta is negative. When the only place our position can make a profit at expiry is below the current price, it makes sense that our position will decrease in value when the underlying price increases, giving us a negative delta.
As time passes the price range where there is any significant delta narrows, and the peaks increase in magnitude. The general shape however remains the same, where we have a positive peak towards the lower end of our strikes and a negative peak towards the upper end of our strikes.
Gamma
As always, as we move from left to right on the delta chart, whenever the delta is increasing, this means the gamma is positive. Whenever the delta is decreasing, this means the gamma is negative. The steeper the line, the more extreme the gamma is. It is useful to remember this when studying gamma charts.
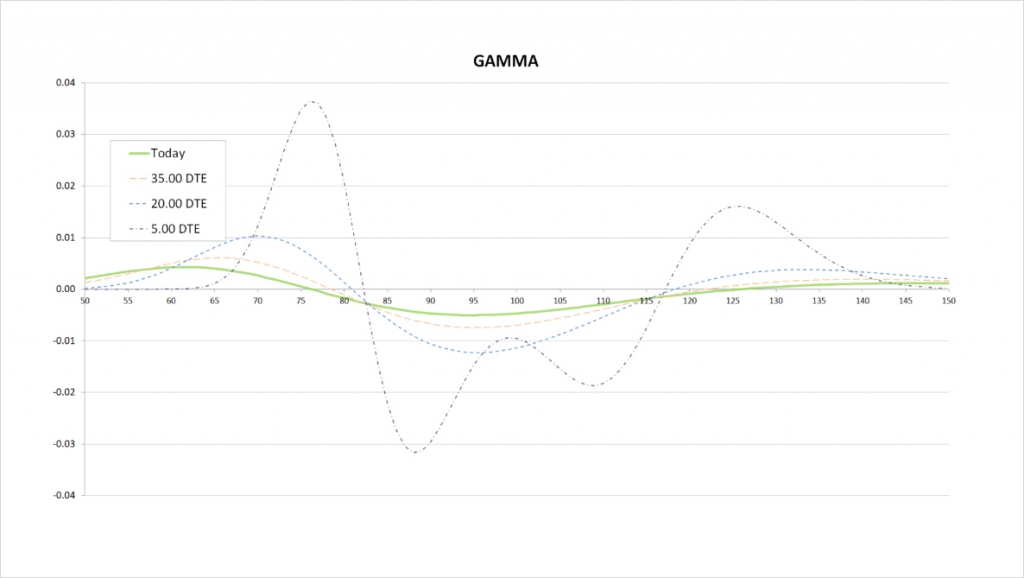
For the current values of delta with 50 days remaining until expiry, we see that delta increases slowly, peaking at a little over $75. It then decreases until the underlying price gets to about $125. On the gamma chart this is shown by starting positive, and crossing the x axis at about the $75 mark where delta peaks. Gamma is then negative while the delta is decreasing. Gamma crosses back into positive at about the $125 mark as the delta begins to increase again.
When we get much closer to expiry we start to see more kinks in the gamma. Remember as we get close to expiry, gamma is greatest when an option is ATM. As we have four options in our condor, this results in four peaks in our gamma. The closer we get to expiry, the closer these peaks will be to our strikes.
We are long the $80 put and the $120 call, so both of these options give us positive gamma. We are short the $85 put and the $115 call, so both of these options give us negative gamma. As we get closer to expiry the price range where each option has any significant gamma gets smaller, which means the option that is closest to the money dominates the gamma for our condor as a whole. This means when there is very little time remaining, we will have positive gamma when the underlying price is close to one of our long strikes, and negative gamma when the underlying price is close to one of our short strikes.
Vega
We are long some options and short others, so the sign of our vega depends on where the underlying price is sitting relative to our chosen strikes.
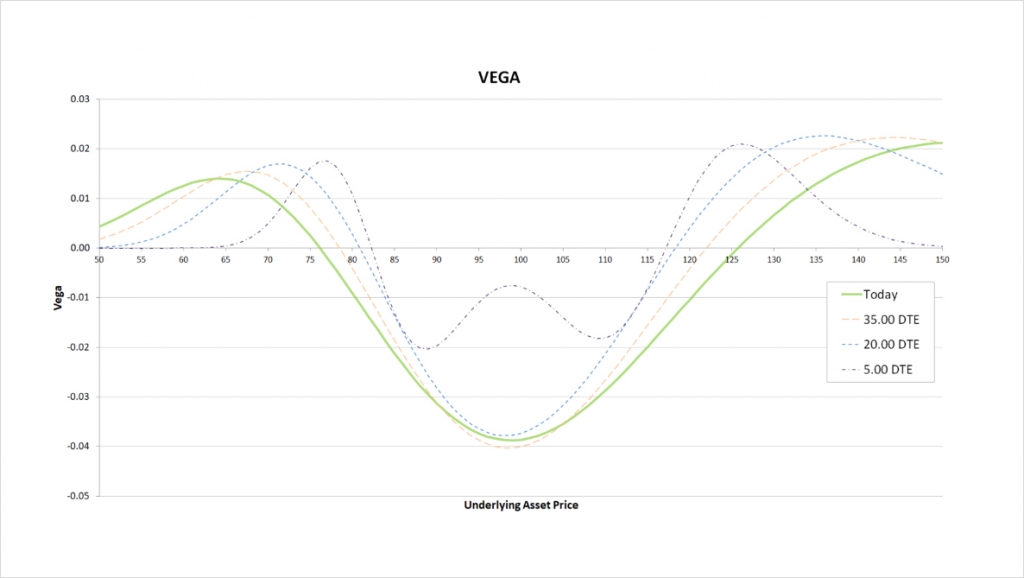
At expiry, our position makes a profit when the underlying price is in between our two short strikes of $85 and $115, so while the underlying price is already sitting somewhere in that range, we want the price to move as little as possible. An increase in volatility would hurt our position, so we have negative vega in the centre of the chart here.
While the underlying price is outside of our range of strikes, we need the underlying price to move, so an increase in volatility helps our position. We therefore have positive vega at either side of this vega chart.
As time passes the vega profile stays roughly the same, but with the price range where we have significant vega decreasing, and vega becoming increasingly concentrated around our strike prices.
Theta
We are long two options that give us some negative theta, and short two other options which give us some positive theta. Whether our iron condor has negative or positive theta depends on where the underlying price is relative to the strikes.
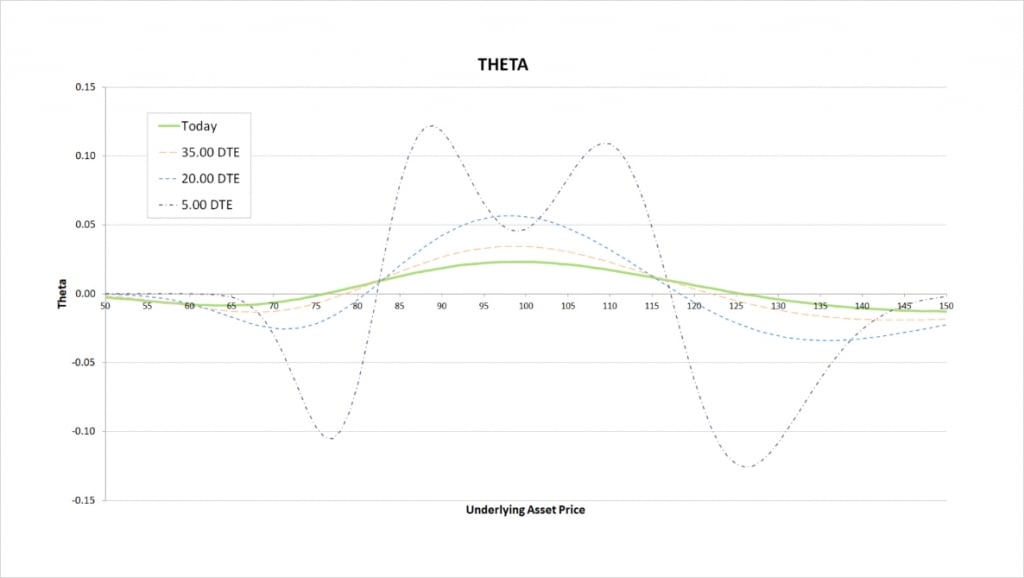
As we just mentioned, at expiry, our position makes a profit when the underlying price is in between our two short strikes of $85 and $115. While the underlying price is already sitting somewhere in that range, time passing without price moving helps our position. We gain as time passes so we have positive theta here.
While the underlying price is outside of our range of strikes, we need the underlying price to move, so the passage of time without price movement hurts our position. We therefore have negative theta when the underlying price is sitting way outside of our range of strikes.
As time passes the theta profile stays roughly the same, but with the price range where we have significant theta decreasing, and theta becoming increasingly concentrated around our strike prices.
Inverse option contracts
Our iron condor was constructed using a bull put spread and a bear call spread. We can do the same when constructing an iron condor using the inverse option contracts on Deribit.
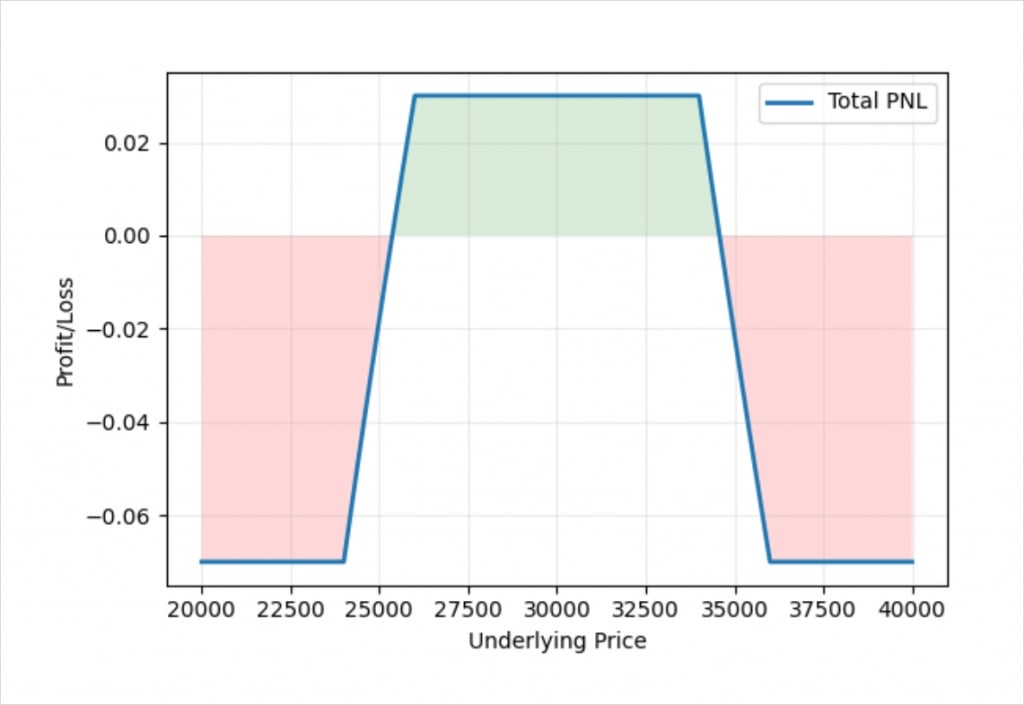
This chart shows the bitcoin payoff at expiry of an iron condor using the bitcoin options on Deribit. In this example we have assumed the underlying price of bitcoin is $30,000, and used the following strikes:
+1 $24,000 put
-1 $26,000 put
-1 $34,000 call
+1 $36,000 call
And we have assumed that we collected a net credit of 0.02 BTC for the iron condor.
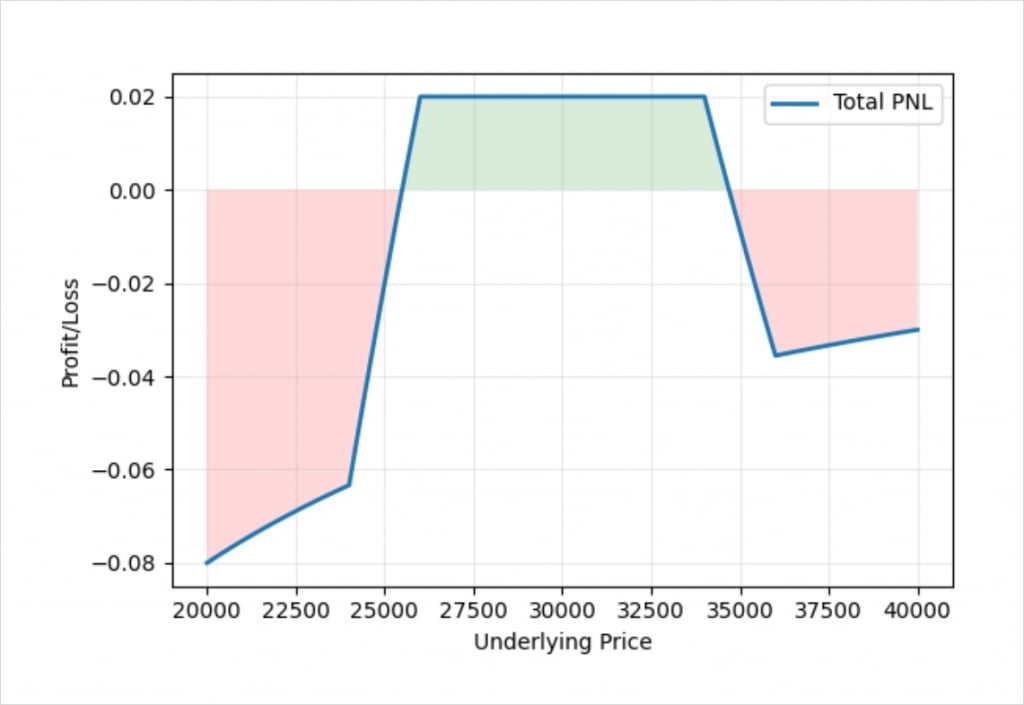
The middle of the chart where we make a profit is very similar to the profit/loss chart we saw earlier for the dollar example. On either side though we see the familiar curve that we get from using inverse contracts. This is due to how much bitcoin it takes to pay a fixed amount of dollars when the underlying price is different. The vertical spread on each side of our iron condor has a fixed width measured in dollars. The maximum amount one of the vertical spreads can be worth if the price is outside of our chosen range at expiry is this fixed amount of dollars, but how much bitcoin it takes us to pay this amount of dollars depends on what the price of bitcoin is.
For example, the width of the vertical spreads is $2,000 (this is the difference between our $24k and $26k strikes, and between our $34k and $36k strikes). If the underlying price is $20,000 at expiry, we will owe a total of $2,000. At an underlying price of $20,000, this equates to 0.1 BTC. If we subtract from that the credit of 0.02 BTC that we initially collected, we are left with a loss of 0.08 BTC.
If instead the underlying price is $40,000 at expiry, we still owe the same $2,000, however with the underlying price of $40,000, this now equates to 0.05 BTC. If we subtract from that the credit of 0.02 BTC that we initially collected, we are left with a loss of only 0.03 BTC.
If we are more concerned about our bitcoin balance than our dollar balance, we may want the spread to be more symmetrical in bitcoin terms. Thankfully this can be achieved by using the method we discussed in the vertical spread lectures at the beginning of this section of the course.
We just need to adjust the position sizes of each leg of the two vertical spreads. For example, if we execute the iron condor with the ratio:
+26 $24,000 put
-24 $26,000 put
-36 $34,000 call
34 $36,000 call
We get the following profit/loss chart:
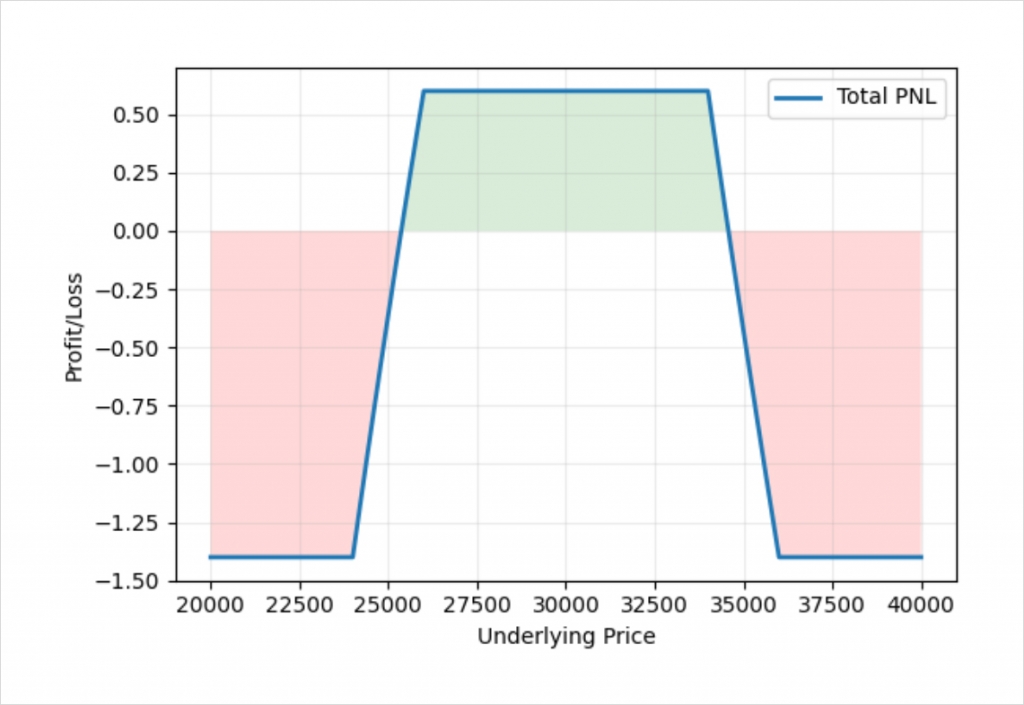
We have managed to construct an iron condor who’s payoff is completely symmetrical in bitcoin terms. We have done so by dealing with each of the two vertical spreads individually, and by using a position size ratio for the legs it contains according to the inverse of the ratio between the strikes.
For the $24k/$26k put spread, we have sized the legs using the ratio 26:24, and for the $34k/$36k call spread, we have sized the legs using the ratio 36:34. The ratio for the whole position then is 26:24:36:34
I’ve used these much larger numbers because that makes it easier to see the method being used, but any multiple of this would do the same job. So if we still wanted the position to be smaller such that it is similar to the first example where each strike had a position size of 1, we could use position sizes of:
+1.3 $24,000 put
-1.2 $26,000 put
-1.8 $34,000 call
1.7 $36,000 call
Doing so would give us this profit/loss chart:
This is much closer to our original iron condor, except we have made it symmetrical in bitcoin terms.
When using only calls or only puts, we can achieve the same thing by using the same ratio.
Condors
Whether constructed with puts, calls, or both, condors offer traders a way to speculate on the underlying price staying within a chosen range. A condor strategy also benefits from having a fixed risk, however care should be taken when using inverse contracts to understand whether your risk is fixed in dollars or the base currency (such as bitcoin). This fixed risk does come at a cost though, as the maximum profit of a condor will be much less than the corresponding strangle, which would be the undefined risk version of this type of strategy.