


We mentioned in the previous lecture that option deltas vary. One variable that has major influence on delta is the underlying asset price, and where it currently is relative to the strike price of each option.
A multiple option view
To begin to understand how the underlying price affects option deltas, let’s take a look at multiple options that share the same underlying asset price, days to expiry, and implied volatility. The only difference between these options is of course the strike price, and therefore where they sit relative to the underlying asset price.
The following chart shows the deltas for all options of a fictional asset with a current price of $100, 30 days to expiry, and implied volatility (IV) of 40%. The strikes range from $50 to $150.
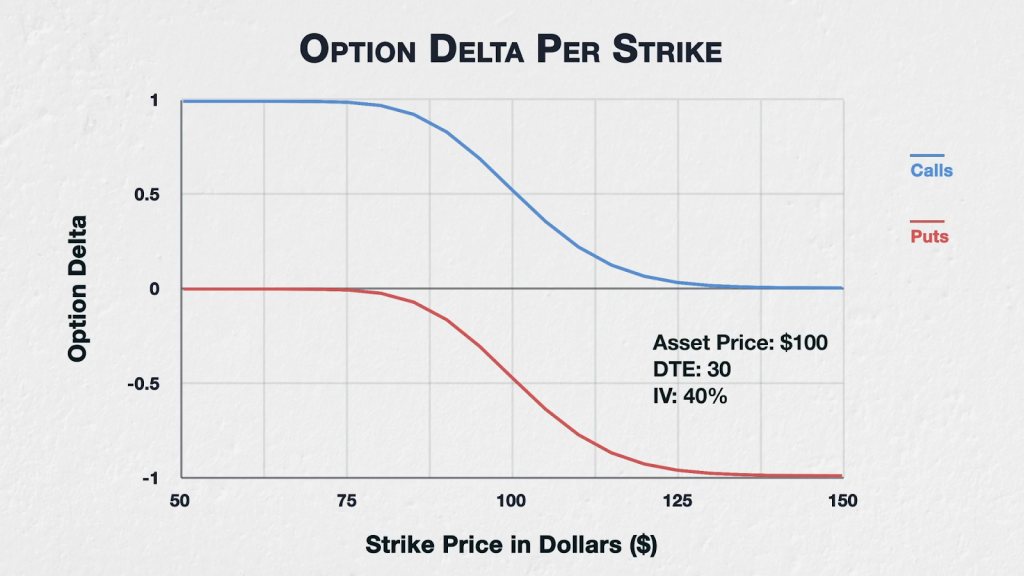
We learned in the previous lecture that call options have positive delta, because they increase in value when the underlying price increases. And as you can see here, the call option deltas (in blue) are all between 0 and 1, with the lower strike calls that are deep ITM having deltas approaching 1, the ATM strike of $100 having a delta of about 0.5, and the higher strike calls that are deep OTM having deltas approaching 0.
We also learned that put options have negative delta, because they decrease in value when the underlying price increases. The put option deltas (in red) are all between 0 and -1, with the lower strike puts that are deep OTM having deltas approaching 0, the ATM strike of $100 having a delta of about -0.5, and the higher strike puts that are deep ITM having deltas approaching -1.
A single option view
Another way of viewing this is to look at the delta of one specific option based on what price the underlying asset is currently trading at. Here we are looking at the call and put options with a $100 strike price, and how their delta is affected by changes in the underlying price.
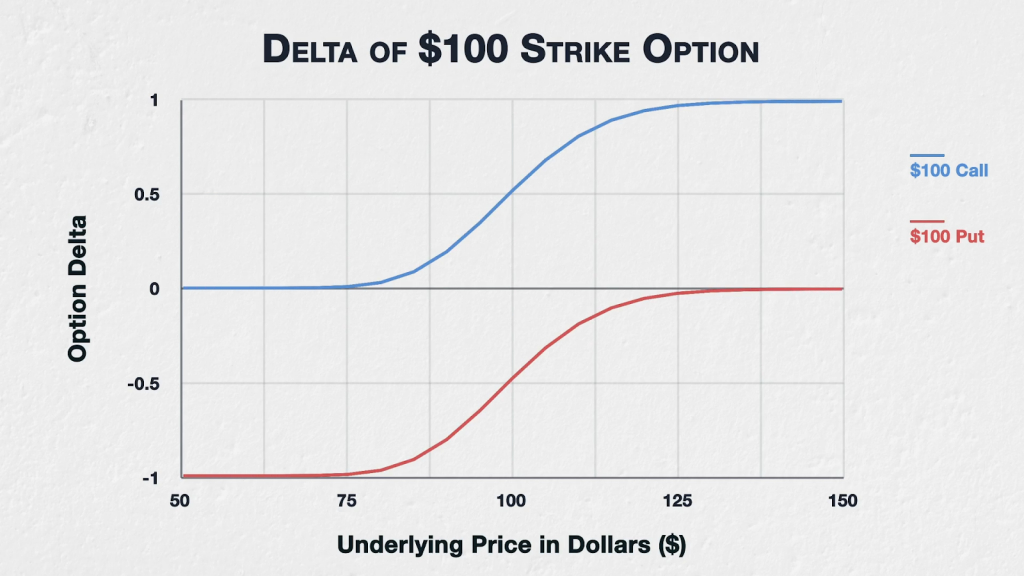
Starting at the left hand side of this chart, we can see with an underlying price of $50, a call option with a $100 strike will have a delta of almost zero. With the underlying price sitting at $50, the $100 strike price call is very far out of the money (OTM), so the option is almost worthless. A $1 increase in the underlying price to $51 will not change this much so the call option would not gain much value, therefore the delta is very close to zero.
Remaining at a $50 underlying price, the put option with a strike price of $100 will have a delta close to -1. The $100 put is deep in the money (ITM), and as such will behave very similarly to a short position in the underlying. A short position in the underlying of course will have a delta of -1, losing $1 for every $1 increase in price.
Moving along the chart to the right, both the $100 call and $100 put options will become at the money (ATM) once the underlying price reaches $100. As we mentioned previously this will result in deltas of approximately 0.5 and -0.5 respectively (though it’s actually closer to 0.52 and -0.48 here). When very close to ATM, each option will act similarly to a half-sized position in the underlying, gaining or losing roughly $0.50 for every $1 move in the underlying.
Now moving on to the extreme right of the chart to an underlying price of $150, the $100 call option is now deep ITM and so it’s delta has increased to nearly 1. It will now behave very similarly to a long position in the underlying, increasing in value by roughly $1 for every $1 increase in the underlying price. The $100 put on the other hand is now far OTM and so it’s delta is now close to zero, with underlying price movements barely affecting its value. The $100 put is almost worthless. A $1 increase in the underlying price to $151 will not change this much so the put option would not lose much value, therefore the delta is very close to zero.
Deribit example
On most option chains you can display the delta of each option in a separate column. To illustrate what we’ve just covered in a real world setting, let’s use this example of an option chain on Deribit. This is the option chain for bitcoin with an expiry date in about 31 days.
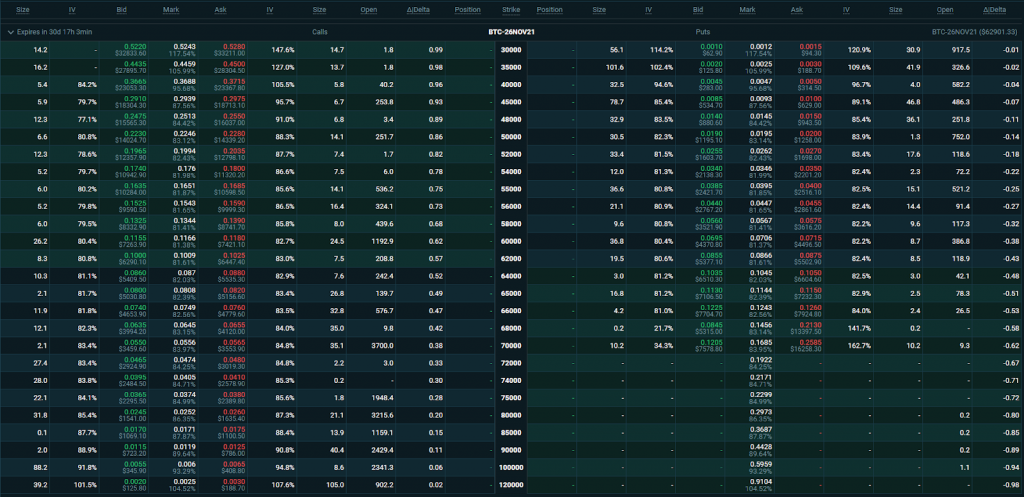
As usual, we have the strikes in the centre with calls to the left and puts to the right. And I have enabled the delta columns here.
The current underlying price is $62901.33, which we can see at the top of the option chain. The lowest strike price for this expiry is at the top of the strikes column, and is $30,000. With the current underlying price of about $63,000, the call option with the strike price of $30,000 is far ITM, and therefore according to what we’ve just covered should have a delta approaching 1. And indeed if we look in the delta column for this call, we can see it has a delta of about 0.99, so very close to 1.
The $30,000 put on the other hand is far OTM, and therefore should have a delta approaching 0. And indeed if we look at the delta column for this put option, it has a delta of about -0.01, so very close to zero.
As we move down through the option chain, the strike prices increase. Eventually we reach the strikes that are ATM or close to it. Here we can see the calls have a delta of a little over 0.5, and the puts have a delta of a little less than -0.5.
If we keep going eventually we get to the highest strike for this expiry, which is $120,000. With the current underlying price of about $63,000, the call option with the strike price of $120,000 is far OTM, and therefore according to what we covered earlier should have a delta approaching 0. And if we look in the delta column for this call, we can see it has a delta of about 0.01, so very close to 0.
The $120,000 put on the other hand is far ITM, and therefore should have a delta approaching -1. And indeed if we look at the delta column for this put option, it has a delta of about -0.99, so very close to -1.
This is just repeating the same concept of course, but it’s useful to bridge the gap between the theoretical charts we covered first, and how delta actually looks on a live website you can use.
In summary
Where the strike price of an option is in relation to the underlying price, will have an impact on the delta of that option.
In general, deep ITM options will have deltas approaching +/- 1 (depending on whether it’s a put or a call, positive for calls, and negative for puts).
ATM options will have deltas of roughly +/-0.5 (again, positive for calls, and negative for puts)
And deep OTM options will have deltas approaching 0.