
“That’s the thing with network effects; there’s really no way to have network effects without having reflexive bubbles. And the more we believe that the software and internet century will be defined and governed by networks, especially if we think that participants in the networks will also own pieces of them, we’d better be prepared for a whole lot of reflexivity. Maybe in the long run, the entire world economy becomes Herbalife. I’d certainly listen to that startup pitch.” – Alex Danco
The reality of Bitcoin is that the value is in the hands of the holder. Many people have tried to apply valuation metrics through on-chain metrics, stock to flow, and other methods to Bitcoin — but at its core the value comes from the level of adoption from a variety of people around the globe. The value of BTC comes from the subjective value that individuals place upon it. The more people that ascribe value to Bitcoin, the more it has (hence the frequent usage of Metcalfe’s law to value Bitcoin).
This uncertain nature of Bitcoin’s valuation is both an asset and a liability, as it can create an atmosphere of FOMO as easily as it can convince people it’s going to zero. Individuals tend to value Bitcoin based on what their peers are doing at the time. In a market where they experience their friends, family or barbers talking about the value of Bitcoin, they are more likely to accept that Bitcoin has value. When they hear people on TV talking about the “bubble pop” people tend to avoid Bitcoin.
This investor behavior creates strong reflexivity. An uptrend, once begun — is likely to continue until the number of participants open to Bitcoin reaches a climax. A down trend is the same but in reverse. This dynamic causes wild swings in the market month to month, year to year, as mini cycles occur within broader adoption. The prevalence of technical analysis exacerbates this trend, as many in the market latch on to the same simple metrics for assessing Bitcoin.
A simple look at the chart provides an intuitive grasp of the trending nature of the asset as there are fairly clear visual market trends you can see with the naked eye.
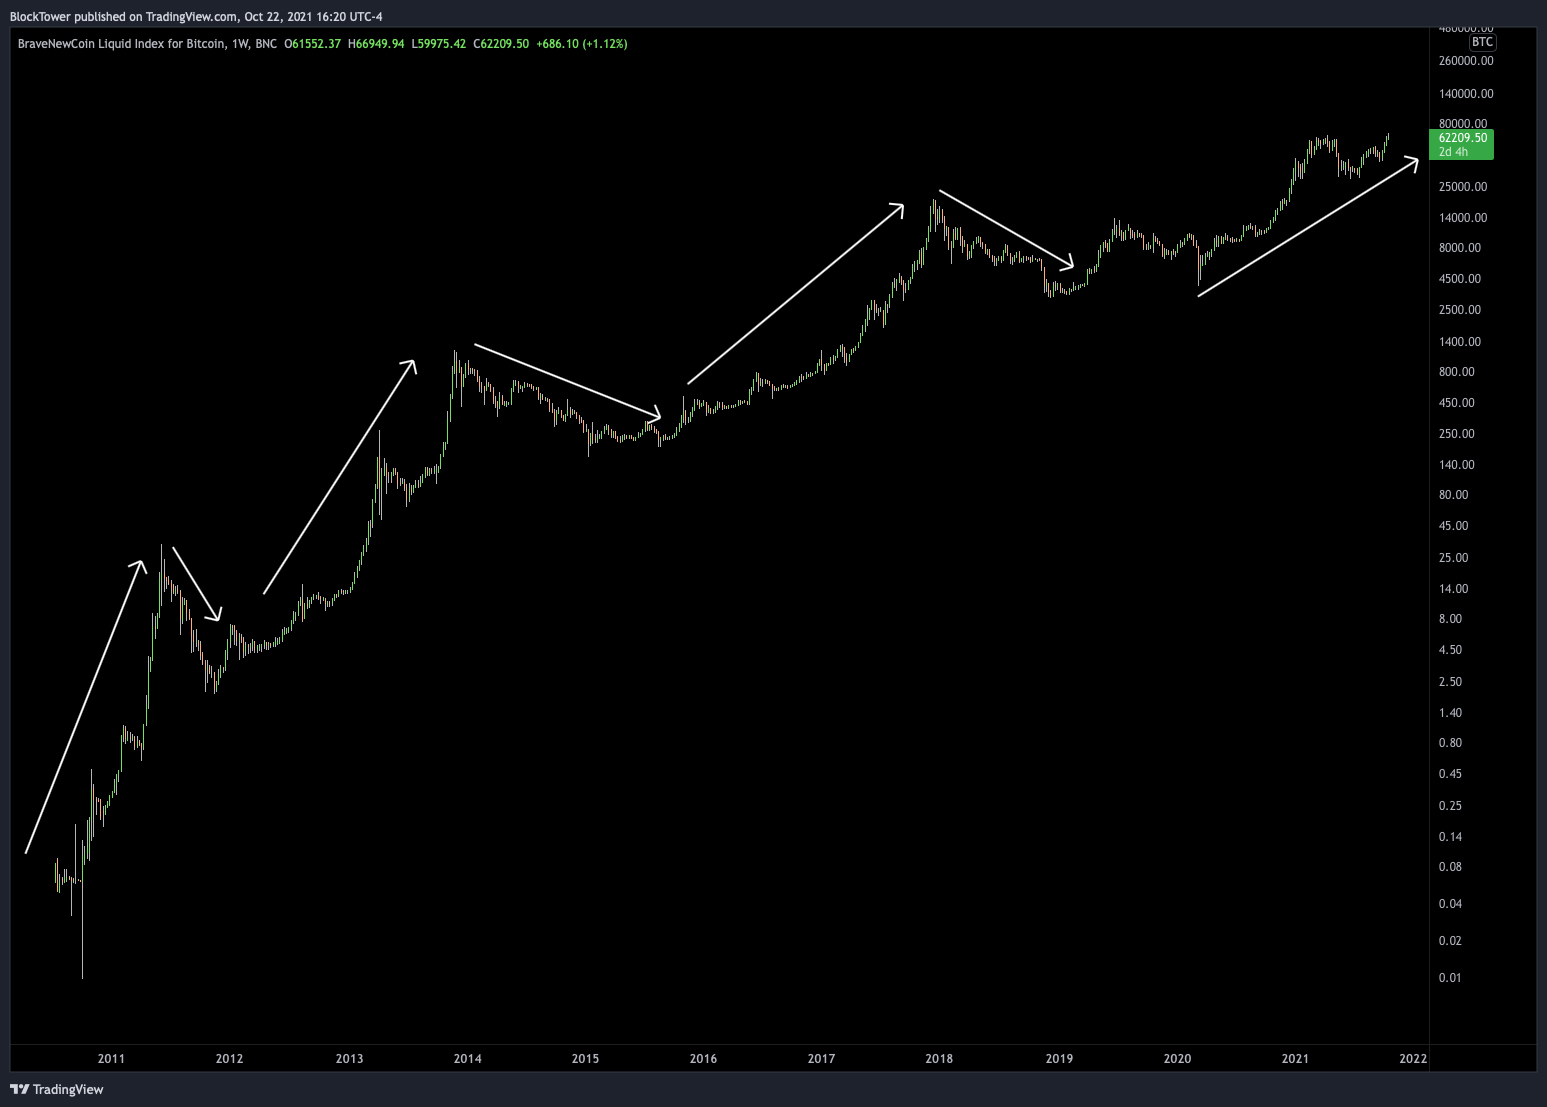
As a trader, spending any amount of time in the crypto markets makes it clear that trend following is a core component of winning in these markets because of the behavior of crypto investors. Now looking at charts can only get you so far, as with anything in life, it’s worthwhile to look at the data to test our empirical assumptions.
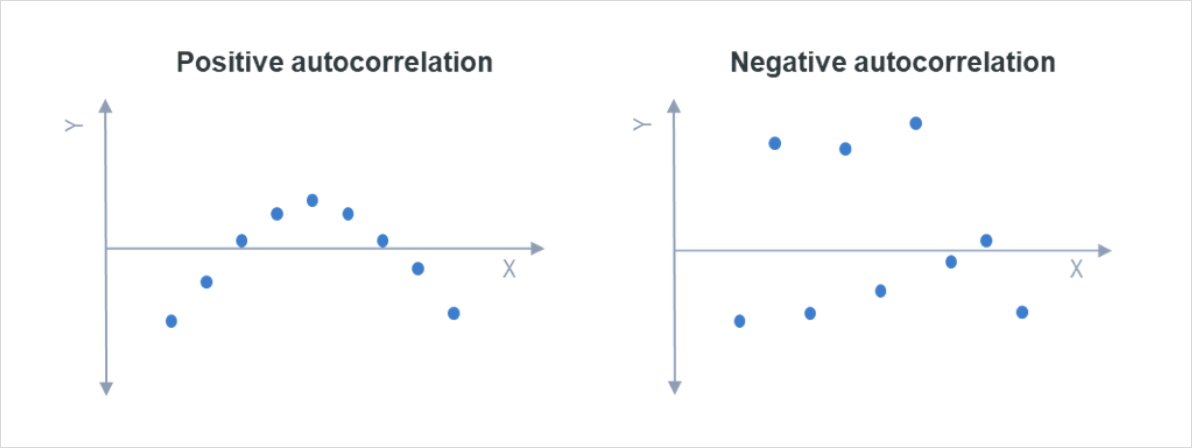
Source: Displayr.com
There are a number of statistical tests that one can run to determine the autocorrelation (tl;dr trending nature) of a time series. One of the most basic tests for autocorrelation is the Hurst exponent. Originally developed by Harold Edwin Hurst for determining optimal dam sizing of the Nile river, it’s been co-opted for the more useful task of determining the autocorrelation of stocks.
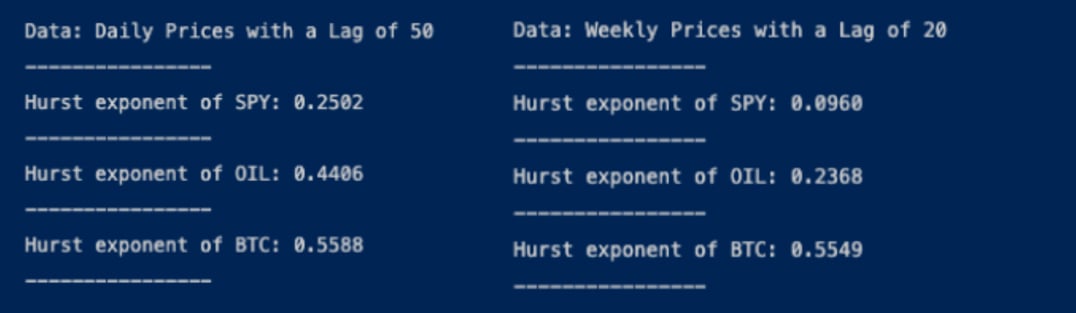
In the table above, we show the Hurst for two years of price for a variety of assets and unsurprisingly Bitcoin came out on top as the most autocorrelated asset. Equities are relatively mean reverting whereas Oil and Bitcoin show higher likelihood of sustained trend during those time periods.
The Hurst exponent doesn’t show the full picture of course, because it doesn’t quantify the magnitude of trend — so if an asset was to go up only 1 bp a day, but every single day, you would find that it would have an extremely high Hurst exponent, Useful for trading the asset, but unhelpful in understand the size of the trend.
To understand the magnitude of returns, it helps to understand the distribution of daily returns and calculate the Kurtosis, which is a description of the “fat-tailedness” of an asset’s returns. The simplest way to visualize this is through a histogram where each bucket of daily returns is plotted. The flatter the histogram, the larger the average move of the asset.
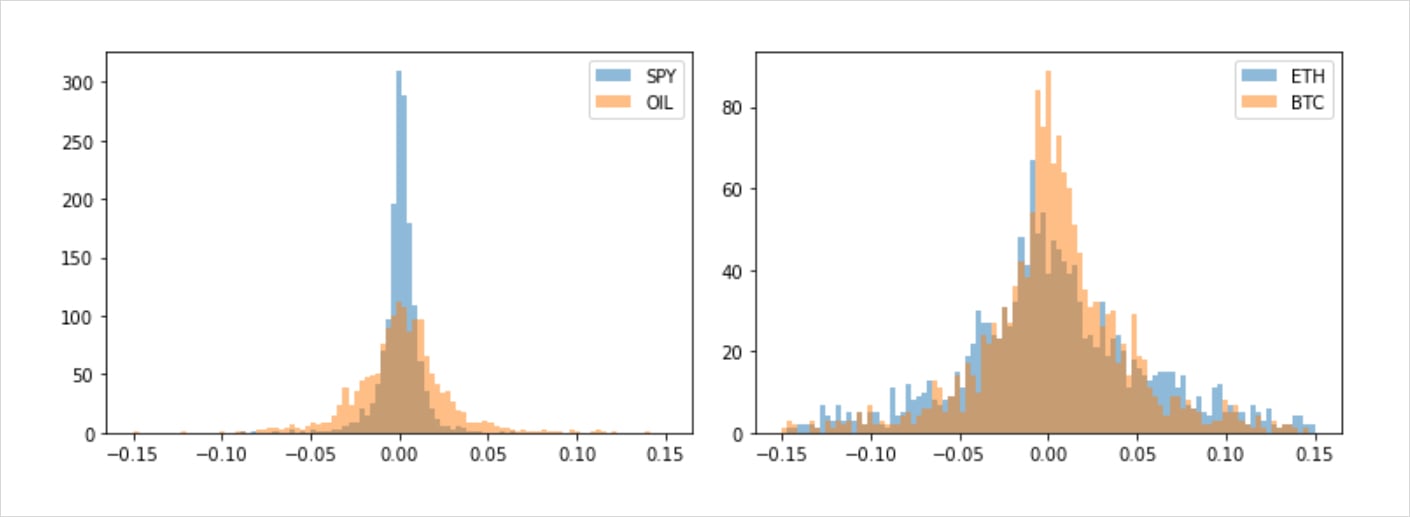
Looking above one can clearly see that Bitcoin and Ethereum have relatively spread out returns indicating a sizable average move. Combined with the Hurst exponent above, we can make a reasonable inference that trends in cryptocurrency are both more common and of larger magnitude than trends in traditional assets, which should lend itself nicely to trend following strategies (and not so nicely to mean reversion strategies).
To further confirm the base exploration above, we ran a few backtests to explore whether a simple trend following strategy indeed works better in the crypto markets than it does in the traditional markets. We defined the basic trend following strategy as follows:
1. Long only
2. Created a Z score of price to the 20 day moving average
a. A Z score is a normalized measure of distance from the mean. 1.8 here means that price is 1.8 standard deviations away from the average distance price is from the 20 day moving average
3. Enter long when that Z score is above 1.8 (indicating that the asset has already displayed strength)
4. Exit long when that Z score is below 1.8, indicating a loss of momentum
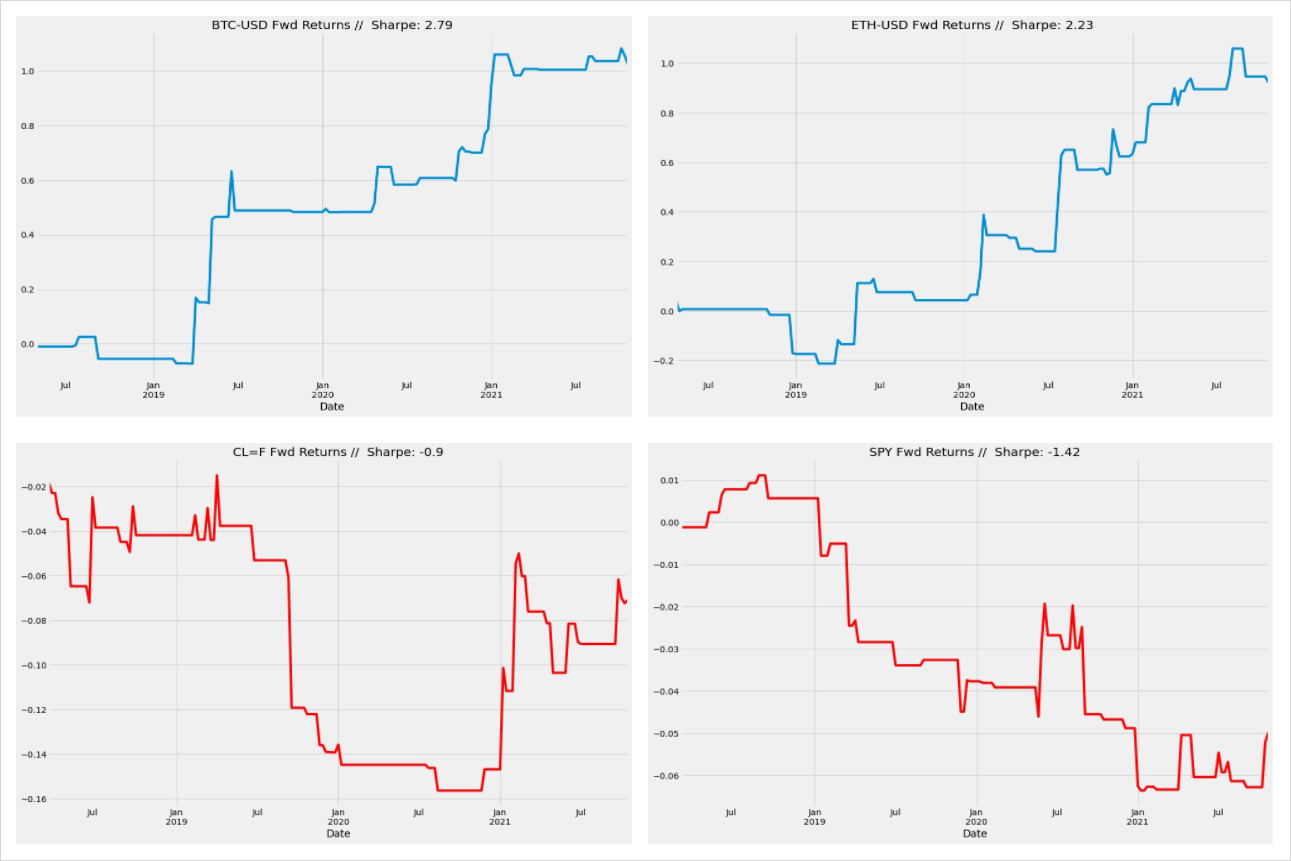
You can see above that crypto assets such as ETH and BTC have better returns and cleaner performance than the TradFi assets, Crude Oil and SPX. Our initial thesis seems to have some merit.
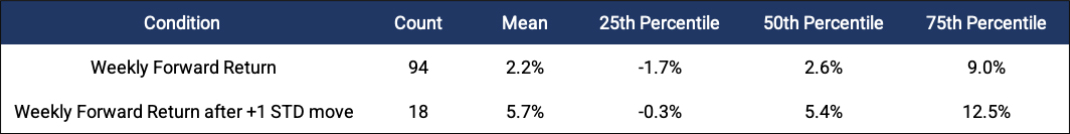
To make the point even more solid on a higher timeframe, we tested the forward returns of a normal week for Bitcoin, and weeks after a large (> 1std) positive move. From the table above, one can see that after Bitcoin posts a strong week, it’s more likely the following week will have higher returns than an average week.
These tests bring us back to the initial points we have made about reflexivity. Unlike cash flow producing companies that constitute the SPX or a physical barrel of oil which can be consumed as a source of energy, crypto networks like BTC and ETH derive their value from usage and confidence, both of which are driven by sentiment. In short, as Soros put it, a higher price leads to better fundamentals, which feeds back into a higher price. This concept of reflexivity is actually a quite useful active trading tool. In this market there is a much higher bar when it comes to fading a trend, relative to hopping on an established trend.
For the average trader, the nature of cryptocurrency markets should have one carefully think about fading the current trend. In future articles we hope to explore more explicitly the metrics one should look at to gauge trend strength and potential reversals.
AUTHOR(S)
Head of Trading @BlockTower . Assets mentioned in tweets may be owned by BlockTower