


Another variable that has a major influence on vega, is how much time is left before the option expires. Even if all other things remain completely static, the simple passage of time will have an effect on the vega of an option.
This chart shows the vega for all options of a fictional asset with a current price of $100, implied volatility of 40%, and varying DTE. The strikes range from $50 to $150, and the DTE ranges from 5 up to 85.
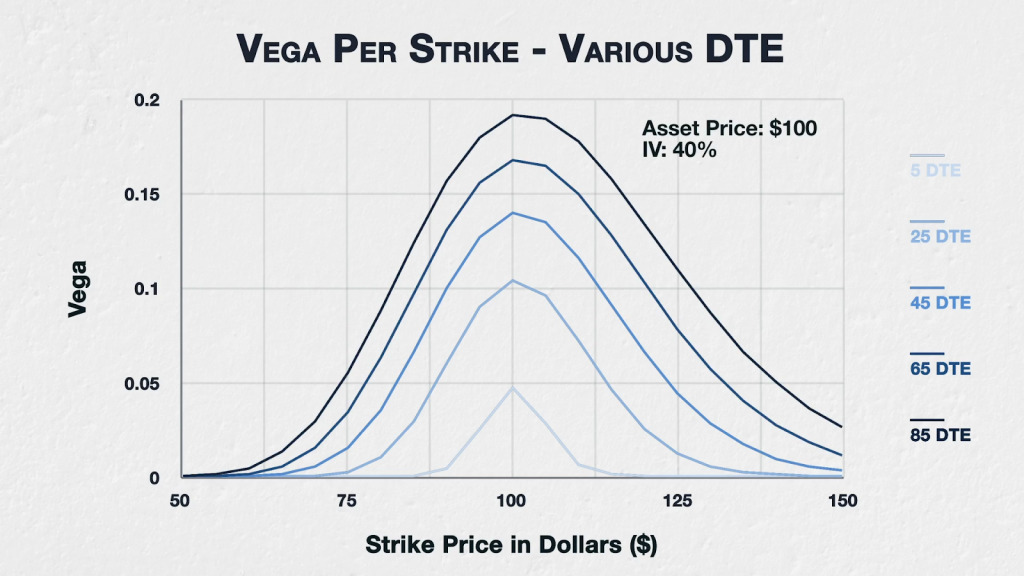
The effect of time on vega is quite clear to see here. Let’s start with the most time to expiry of 85 days at the top. For every strike, the vega is higher than that of the next highest DTE of 65. Similarly the 65 DTE line is higher at every strike than the 45 DTE line. This trend continues all the way down until we get to the last line here which is 5 DTE.
Assuming all else remains equal, vega decreases as time passes. The more time is left until expiry, the higher the vega will be for all strikes, and the less time is left until expiry, the lower vega will be for all strikes.
This behaviour holds even if we significantly increase the implied volatility. Here we have the same chart, but instead of 40% IV, I’ve increased it to 125% IV.
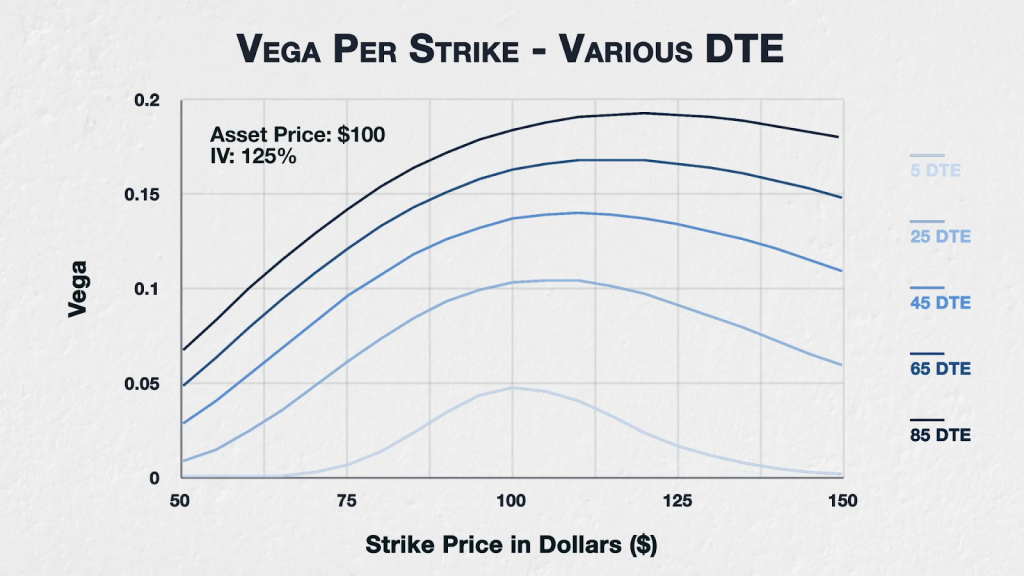
For the higher DTE, we can see the behaviour we discussed in the previous lecture, where the peak drifts higher in price. However it still holds that for every strike, the more time that is left until expiry, the higher the vega.
Individual option views
Let’s now look at 5 specific strikes to illustrate how their vega evolves as time passes.
This chart shows the vega of the $80, $90, $100, $110, and $120 strikes. The asset price is $100, and IV is set to 40%. The x axis now shows the DTE, so as we move from left to right on the chart, we can see how the vega changes for each of these strikes as time passes.
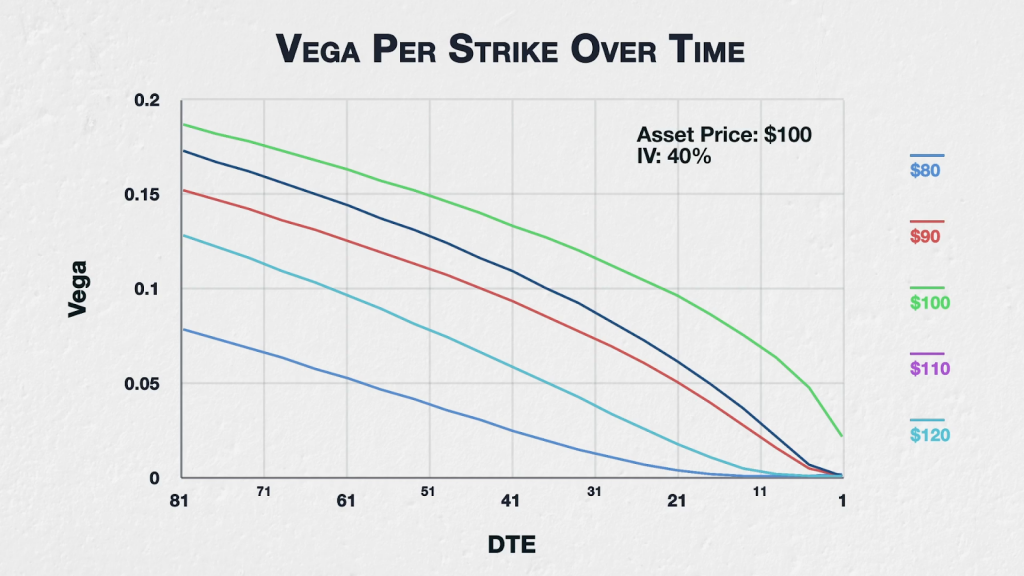
With these parameters we can see the vega of the ATM strike of $100 decreases steadily at first, then decreases at an accelerating rate as we come into expiry.
The next closest strikes of $90 and $110 behave similarly, though with lower values, except for when we get very close to expiry (which is also when most of their extrinsic value will be gone).
Moving further away from the underlying price again, to the $80 and $120 strikes, we see their vega reduces at a relatively steady rate at first, then this rate slows down as we come into expiry. This happens earlier for these strikes because they are further away from the underlying price. They will of course therefore lose most of their extrinsic value sooner as well.
You may think this chart looks familiar, as it looks very similar to the extrinsic value chart in lecture 9.4, where we discussed the rate at which options lose their extrinsic value as time passes.
In summary
The more time is left until an option expires, the more extrinsic value it will have. Any changes to IV will have a larger effect in dollar terms to the option premium.
The higher the DTE, the higher the vega. The lower the DTE the lower the vega. This is true for all strikes.