


Each of the Greeks we have covered so far (delta, theta, and vega,) are first order derivatives. Gamma is different as it is a second order derivative, and it is the first and only second order Greek we will be looking at in its own section during this course.
First order Greeks measure the sensitivity of the option price to a change in a particular parameter. In other words the current rate of change of the option price with respect to the parameter in question.
Second order Greeks measure the rate of change of a first order Greek with respect to a particular parameter. In other words they are measuring the rate of change ‘of a rate of change’ with respect to a parameter.
Gamma definition
Gamma is a measure of the sensitivity of an option’s delta to changes in the underlying price. More specifically, it tells us how much the option’s delta is expected to change if the underlying price increases by $1.
Gamma is always positive for option buyers, meaning that the delta of their option will increase if the underlying price increases by $1.
Let’s think about what that means by using a call option as an example. In lecture 8.2 we looked at how the delta of a call option changed as the underlying price changes. We looked at this chart, which shows the delta of both the $100 call (in blue) and the $100 put (in red). We have also set a DTE of 30 and IV of 40%.
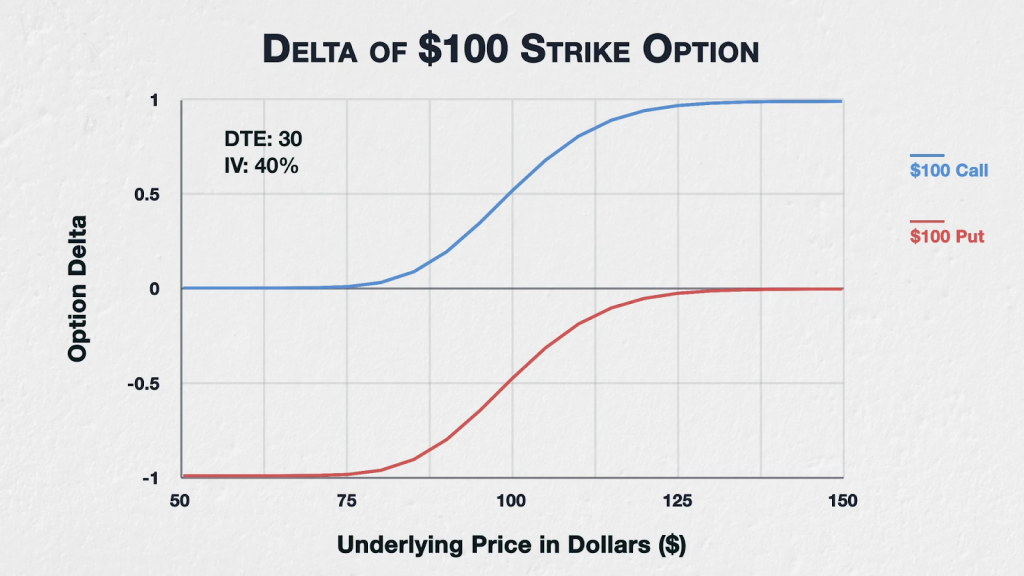
When the underlying price is at $100, the $100 strike call option has a delta of about 0.523. However, when the underlying price is at $101, the delta is about 0.557. When the underlying price is $110, the delta is about 0.813, and when the underlying price is $90, the delta is about 0.195.
So delta can vary a lot based on movements in the underlying price, but as we can see from the chart, this change in delta is not linear. Delta is increasing or decreasing at varying rates. If we take a point on the chart, say at $90, and take a tangent from the delta line, this gives us the current rate of change of delta. This is essentially what gamma is. It’s telling us how fast delta is changing. The steeper the tangent line, the faster delta changes based on a change in the underlying price, and therefore the higher the gamma.
When the underlying price is at $100, the $100 strike call option has a delta of about 0.523. The 0.523 delta means that if the underlying price increases by $1 to $101, if all else remains equal, we would expect our call option to gain about $0.523 of value. For that $1 of underlying price movement between $100 and $101, this is an equivalent profit to if we had initially bought $52.30 worth of the underlying asset instead of the call option.
Let’s jump up quite a bit higher, to an underlying price of $110. With the underlying price at $110, the delta of this $100 strike call option is about 0.813. The 0.813 delta means that if the underlying price increases by $1 to $111, if all else remains equal, we would expect our call option to gain about $0.813 of value. For that $1 of underlying price movement between $110 and $111, this is an equivalent profit to if we had initially bought $81.30 worth of the underlying asset instead of the call option.
What this means is that when we are long a call option:
-As the underlying price increases, our effective long position gets larger, and
-As the underlying price decreases, our effective long position gets smaller.
This is an attractive property to have, and is brought about by the change to delta as price moves, i.e. the gamma.
Put options
Similar behaviour can be observed if we are long a put option.
-As the underlying price decreases, our effective short position gets larger, and
-As the underlying price increases, our effective short position gets smaller.
Option sellers
So the buyers of both call and put options are long gamma, meaning their position’s delta will increase as the underlying price increases, and their delta will decrease as the underlying price decreases.
For option sellers the opposite is true. For option sellers, their position’s delta will decrease as the underlying price increases, and their delta will increase as the underlying price decreases. This means that sellers are effectively getting shorter as the underlying price increases, and getting longer as the underlying price decreases. This can lead to something called a gamma squeeze, which we will cover later in the course.
Gamma examples
If a call option has a delta of 0.5 and a gamma of 0.02, if the underlying price increases by $1, the delta of the option is expected to increase by 0.02 to 0.52. If the underlying price decreases by $1 instead, the delta of this same option is expected to decrease to 0.48. We can see here the expected behaviour of getting longer as price increases and shorter as price decreases.
If a put option has a delta of -0.45 and a gamma of 0.03, if the underlying price increases by $1, the delta of the option is expected to increase by 0.03 to -0.42. If the underlying price decreases by $1 instead, the delta of this same option is expected to decrease to -0.48. Again displaying the expected behaviour of getting longer as price increases and shorter as price decreases.
Summary
An option’s gamma tells you how much the option’s delta is expected to change if the underlying price increases by $1. This is assuming that everything else, like the implied volatility and time to expiry, remains the same.
Option buyers have positive gamma, meaning their delta increases as the underlying price increases, and decreases as the underlying price decreases.
Option sellers have negative gamma, meaning their delta decreases as the underlying price increases, and increases as the underlying price decreases.
Gamma is not static over the life of the option. While gamma is the sensitivity of the option delta to changes in the underlying price, gamma itself has sensitivity to various parameters. We will cover these throughout the rest of this section.