


In the previous lecture we discussed how the rate at which an option’s delta changes based on underlying price movements, i.e. the gamma, is not the same at every underlying price point. Where the underlying price is relative to the strike price has a large effect on gamma.
We looked at this chart that shows the delta of a $100 strike call and a $100 strike put for various underlying prices.
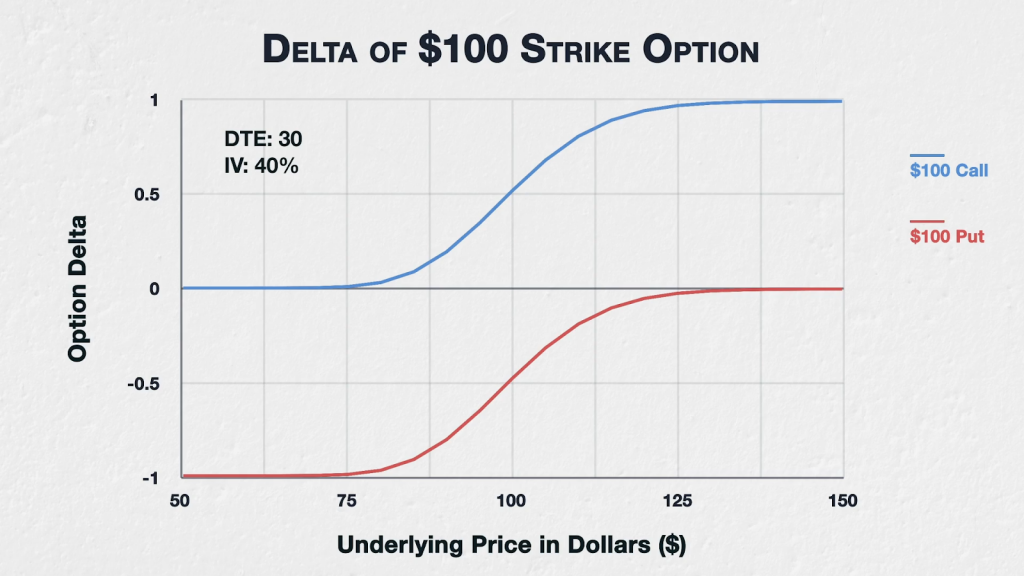
Gamma is a measure of how much the delta will change as the underlying price changes. So gamma measures how quickly this delta line moves up or down as we move the underlying price from left to right.
We’ll bring on the gamma chart shortly, but let’s see if we can figure out what it’s going to look like with these parameters without doing any calculations.
Moving from left to right on the delta chart, we can see that as we move from an underlying price of $50 to $60 to $70, the delta barely changes, despite a considerable change in underlying price. We would expect the line for gamma to be close to zero here then.
As we get to $80 and $90, the delta now starts to change at an accelerated pace. So we would expect gamma to begin to increase here.
By the time we get to $100, which makes the $100 options ATM, the delta is changing at the fastest rate we can see on the chart. We therefore would expect to see gamma peak here.
As we get to $110 and $120, the pace at which delta is changing begins to slow. So we would expect gamma to begin to decrease here.
And finally, once we get to $130, $140, and $150, the delta is barely changing again, so we would expect the gamma to again be close to zero.
Just by looking at the chart for the option’s delta then, we can get a pretty good idea of what the chart for gamma is going to look like. It will peak when the option’s are ATM, falling off in both directions as the underlying price moves further away from the strike price.
Now let’s look at the actual values. This chart shows the gamma for the $100 strike.
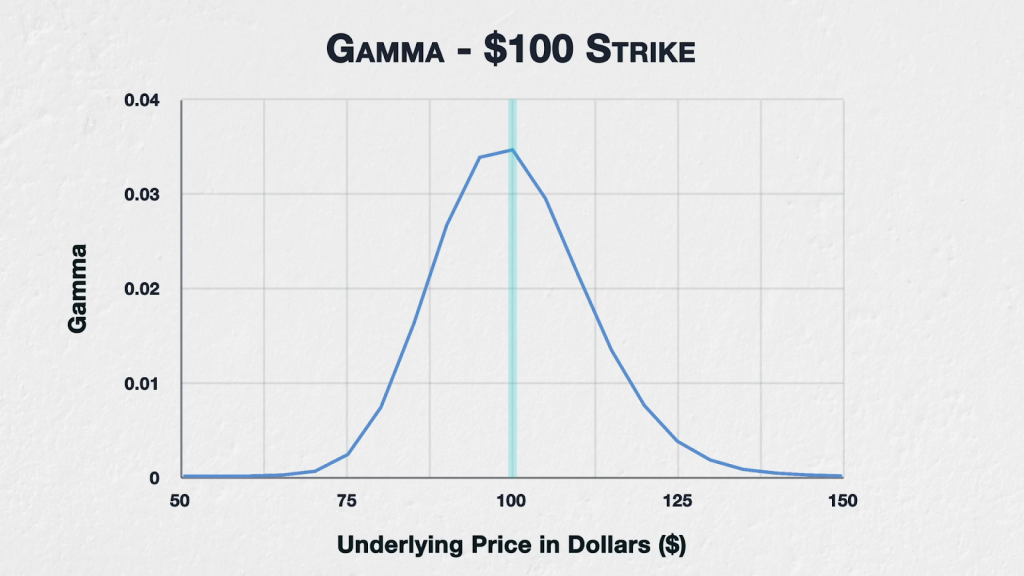
As we suspected, in this example, gamma is highest when the option is ATM. Gamma then falls off in both directions as the underlying price moves further away from the strike price. At the extremes, gamma is very low, meaning a $1 change in the underlying price has little effect on the delta of the option.
In summary
Where the strike price of an option is in relation to the underlying price, will have an impact on the gamma of that option.
Calls and puts of the same strike price and expiration date, share the same gamma figure.
Though the peak gamma can be at strike prices higher than the underlying price if IV and/or DTE are much higher, ATM options typically have the greatest gamma. Gamma then decreases in both directions as we move further away from the underlying price.