


Implied volatility will also affect the gamma of options. Let’s take a look at the $100 strike from the previous lecture again, but this time see how different levels of implied volatility affect the gamma.
This is the same $100 strike option, with 30 DTE.
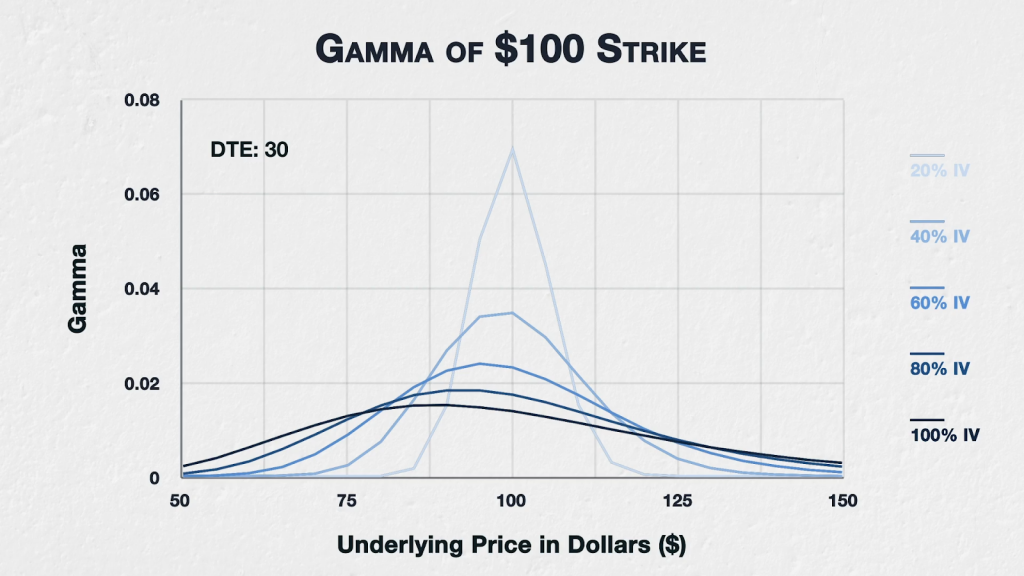
In the previous lecture we only looked at the 40% IV level, but now we can see IV levels from 20% to 100%. At 20% IV, we see a sharp peak in gamma when the option is ATM, falling off quickly in both directions.
As we increase IV, we see a few things happening.
-The gamma for this option peaks at a lower underlying price as we increase the IV.
-The fall off is also slower, with gamma being increased when the strike price is further away from the underlying price. The higher the IV, the flatter the curve, and the further away from the strike price the underlying price can be while we retain some gamma.
-The underlying price at which the gamma for this option peaks moves down in price. This means Gamma peaks when the strike price is higher than the underlying price when IV is increased. At 20% IV the peak is clearly when the option is ATM. By the time we get to 80% IV, peak gamma is actually when the underlying price is closer to $92 instead.
If we compare this gamma chart to a chart of the corresponding deltas, we can understand why we see these patterns. This is a chart of the corresponding deltas. All parameters are exactly the same, except the delta is displayed instead of the gamma.
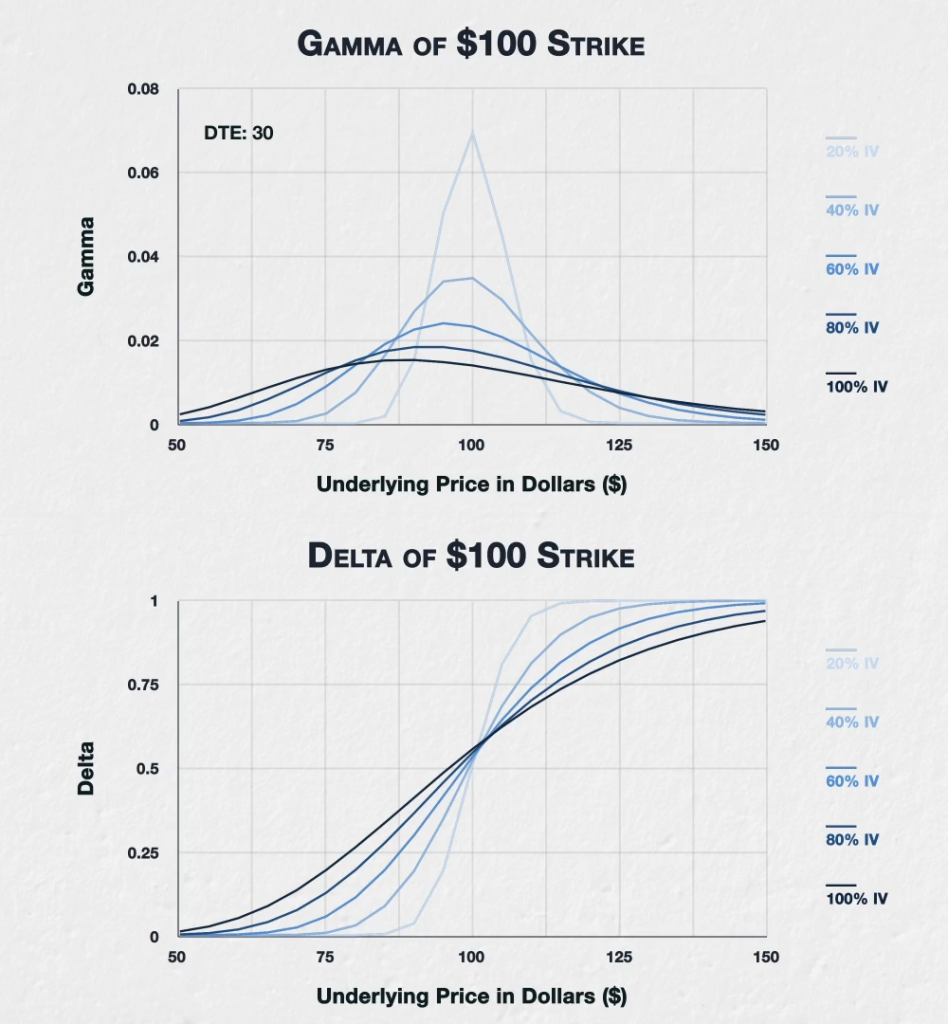
Remember the gamma is simply the rate of change of delta, so the gamma chart is telling us how steep the corresponding line on the delta chart is.
For example, if we look at the 20% line on the delta chart, we can see that it is steepest, that is the delta is changing at the fastest rate, when the underlying price is at about $100. This corresponds with the peak on the gamma chart for 20% IV being at about $100. We can also see that the delta quickly reaches the extremes of 0 and 1 within a narrow price range, hence why the gamma chart for 20% IV is also very narrow.
Now let’s go to the other end of the scale and look at the 100% IV line. With 100% IV we can see the delta line is at its steepest when the underlying price is at about $88 instead. This corresponds with the peak on the gamma chart for 100% IV being at about $88.
We can also see that the delta takes much longer to get close to the extremes of 0 and 1. In fact even with the underlying price at $150, the delta of the $100 call is still well below 1 here. We can see this reflected on the gamma chart by the gamma line being lower but wider.
In summary
The level of implied volatility will have an effect on gamma for all options.
Lower IV will result in the peak of gamma for an option being when the underlying price is closer to the strike price of the option.
Higher IV will result in the peak of gamma for an option being when the underlying price is lower than the strike price of the option. If we phrase this from a multi option perspective instead of looking at a single option as we have done here, this means with higher IV peak gamma will be with options that have a strike price higher than the current underlying price.
Lower IV will also result in a higher peak, and a narrower range before gamma reduces to negligible amounts.
Higher IV will result in a lower peak, and a wider range before gamma reduces to negligible amounts.