
A covered call is a strategy that involves buying the underlying asset, and then selling a call option against that position at a ratio of 1:1. The sale of the call option, which by itself would have unlimited risk, is instead ‘covered’ by holding the underlying asset. As such, it is the first strategy we are looking at that combines an option with a different type of instrument, in this case a long position in the underlying asset.
The call option sold will typically be out of the money (OTM), as this means the trader can still benefit from the underlying price increasing, but they have also collected some premium. This collecting of the premium means even if the underlying price decreases, their losses will be reduced, and they may even still make a small profit.
Aside from a simple long option position where a trader buys a call or buys a put, a covered call is one of the simplest option trades there is. They can initially cause some confusion for people making the switch over to cryptocurrency options, but as we will show later, they are actually just as simple to execute with inverse contracts.
Although a call is sold, which would be a bearish strategy by itself, a covered call is a bullish strategy, and therefore gives us a positive delta. The strategy is constructed by:
– Purchasing the underlying asset at the current price
– Selling a call for every unit of the underlying asset that was purchased. For example if we purchase 1 bitcoin, we would then sell 1 bitcoin call option to make it a covered call. The strike price of the call option sold is typically OTM.
Purchasing the underlying at the current price and selling a call with a strike price of A, will lead to a payoff chart that looks something like this at expiry:
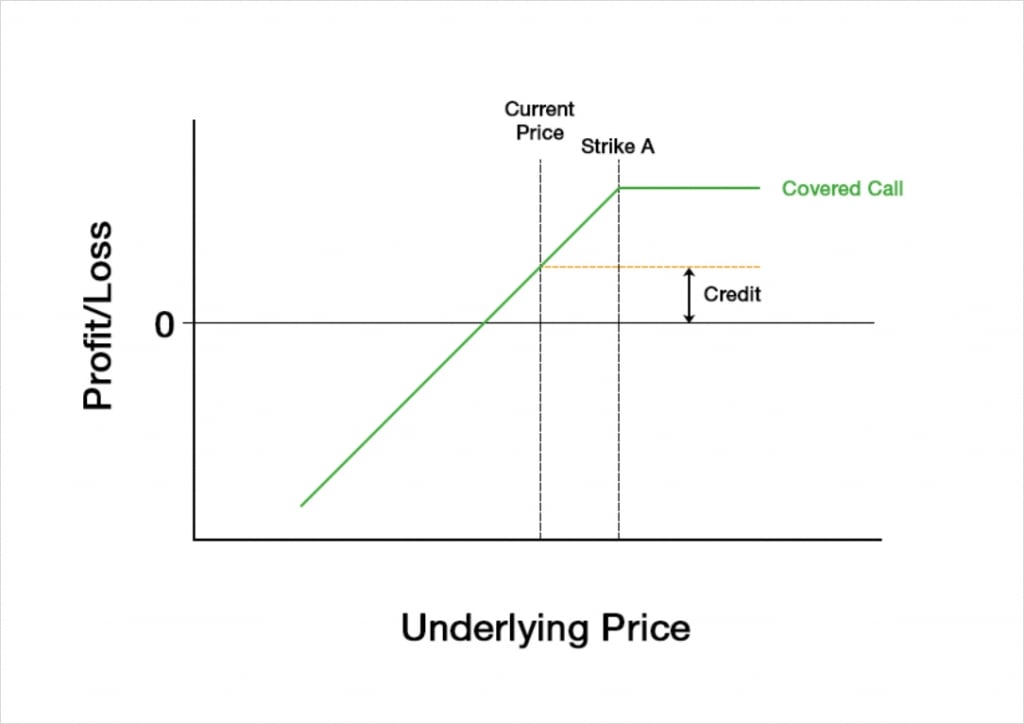
Much like when selling a call, the maximum profit of a covered call is capped. However, unlike when just selling a call the cap on profit can be different to the credit collected for selling the call. If we sell an OTM call, the maximum profit will be higher than the credit collected.
The maximum profit is equal to the credit collected, plus the difference between the strike price of the sold call and the price paid to purchase the underlying.
Max profit = credit + (strike A – current price)
Another difference you will notice between a covered call and a naked short call, is that the risk for the covered call is to the downside, whereas the risk for a naked short call is of course to the upside.
What we are doing when we sell a call is agreeing to sell the underlying to another trader at the strike price on the expiry date. If we do not already own the underlying, this means if the price of the underlying at expiry is above our strike price, we will be forced to buy the underlying, and pay a higher price for it. The higher the underlying price, the more we will have to pay. This clearly leaves us with risk to the upside.
When we execute a covered call though, we do own the underlying as well. This means that no matter how high the price is at expiry, we will not have to purchase the underlying in order to meet our obligations from selling the call. As we own the underlying though, we do have risk to the downside if the value of that underlying decreases. This is why the risk is on the other side of the chart compared to a naked short call.
Synthetic positions
This is a good moment to introduce synthetic positions. That is, positions that behave like one instrument, but are actually constructed using different instruments. For example, we may use instruments A and B, to construct a position that behaves exactly like instrument C. In this instance, if A + B = C, then we have constructed a synthetic position in C.
Notice with our covered call example that the maximum profit is capped, and that the risk is to the downside. You may have noticed that these characteristics are also what define the payoff chart of a short put option.
If we purchase the underlying asset and simultaneously sell a call option at strike A, this is equivalent to simply selling a put option at strike A.
Even though selling a put is simpler than buying an asset and also selling a call, there are still reasons we may wish to execute a covered call rather than selling a put. If the strike price we wish to sell is above the current underlying price, the call is OTM and the put is ITM, which may mean the call has better liquidity. Or we may already own the underlying, meaning selling a call is actually simpler than selling the underlying and selling a put.
Whatever the reasons for choosing either though, it’s worth being aware that options can also be constructed synthetically using the underlying and a different option.
Back to our covered call. To summarise the risk/reward profile, we see that we collect a net credit, the profit is capped, and that the risk is only capped by the underlying price reaching zero. So the risk/reward is the same as selling a put.
The Greeks
A covered call is a combination of an option position, which has all the usual Greeks that we have been covering so far in the course, and a position in the underlying, which only has a delta of one and no other Greek values. So with the exception of the delta of the position, the Greeks for the covered call will be the same as the Greeks for shorting the call.
To analyse how the Greeks behave we will need to assign some figures to each of the Black Scholes parameters. For today’s example of a covered call we will assume the following parameters:
Underlying price: $100
Time to expiry: 50 days
Interest rate: 0
Implied volatility: 60%
Strike A: $110
This means that we will purchase 1 unit of the underlying at the current price of $100, and simultaneously sell an OTM call option with a strike price of $110.
Profit and loss
With these parameters the covered call will initially give us a credit of about $5.12. The payoff chart looks like this.
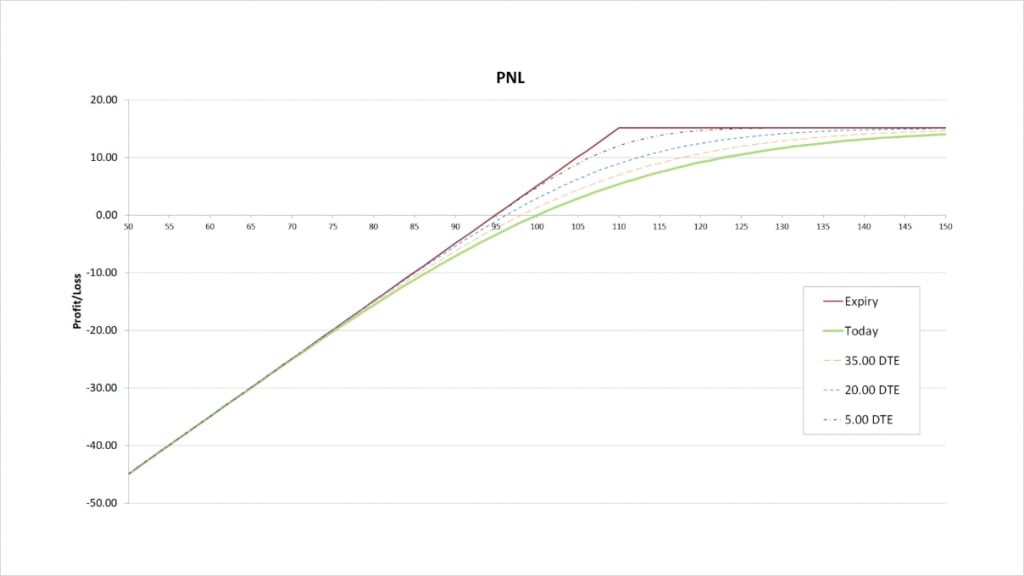
The maximum profit is capped at the premium collected plus the difference between the strike price and the current underlying price when the position is opened. The credit received is $5.12, and when we subtract the underlying price of $100 from the strike price of $110, we get $10. The maximum profit is therefore capped at:
$5.12 + $10 = $15.12
This maximum profit occurs when the underlying price is at or above the strike price of $110 at expiry.
The maximum loss is only capped by the underlying price reaching zero. Despite also being a relatively simple strategy, unlike the vertical spreads we discussed previously, a covered call has (almost) unlimited risk. If the price of the underlying decreases significantly, the losses from holding the underlying can far outweigh the credit received for selling the call.
The breakeven price can be calculated by subtracting the credit received for selling the call from the underlying price of $100. This gives us:
$100 – $5.12 = $94.88
Delta
As a covered call is a bullish strategy that benefits from an increase in the underlying price, the total delta will be positive. We are short the $110 call which always gives us some negative delta between 0 and -1. However we are also long the underlying, which always gives us a delta of 1. This means that the delta for our covered call will always be somewhere between 0 and 1.
This chart shows the delta of the covered call, with the x axis being the underlying price. The extra lines also show how the delta will evolve as time passes.
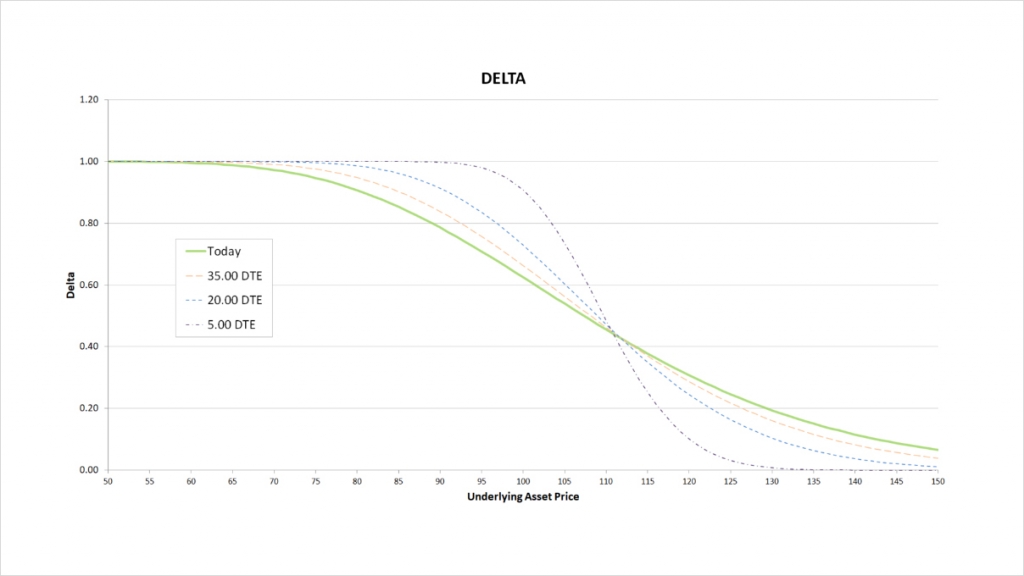
Starting on the left side of the chart, when the $110 call is far OTM it has very little delta. Most of the delta for our covered call here comes simply from our long underlying position. This results in our delta being very close to 1. As we move to the right, the increasing underlying price causes the call to get closer to the money, and it therefore starts to pick up some delta. As we are short the call, it gives us a negative delta.
The higher the underlying price moves, the higher the delta of the call, resulting in a lower and lower delta for our covered call. Eventually when the call is deep ITM, it will begin to give us a delta of -1 (because we are short the call), so it will increasingly cancel out the positive delta we have from holding the underlying.
As time passes the delta of an OTM call approaches 0, and the delta of an ITM call approaches 1. The delta we have from holding the underlying though remains constant at 1. Therefore as time passes, the delta of our covered call approaches 1 when the call is OTM, and the delta of our covered call approaches 0 when the call is ITM.
The delta for the covered call then is always positive, and reduces as the underlying price increases. The delta for the covered call is also the same as the delta of selling the $110 put instead. In fact, when we assume that interest rates are zero, this is the case for all the Greeks, so the Greeks of a covered call are the same as the Greeks of selling a naked put at the same strike price.
Gamma
As always, as we move from left to right on the delta chart, whenever the delta is increasing, this means the gamma is positive. Whenever the delta is decreasing, this means the gamma is negative. The steeper the line, the more extreme the gamma is.
As we just saw, the delta for the covered call is always decreasing, therefore the gamma is always negative.
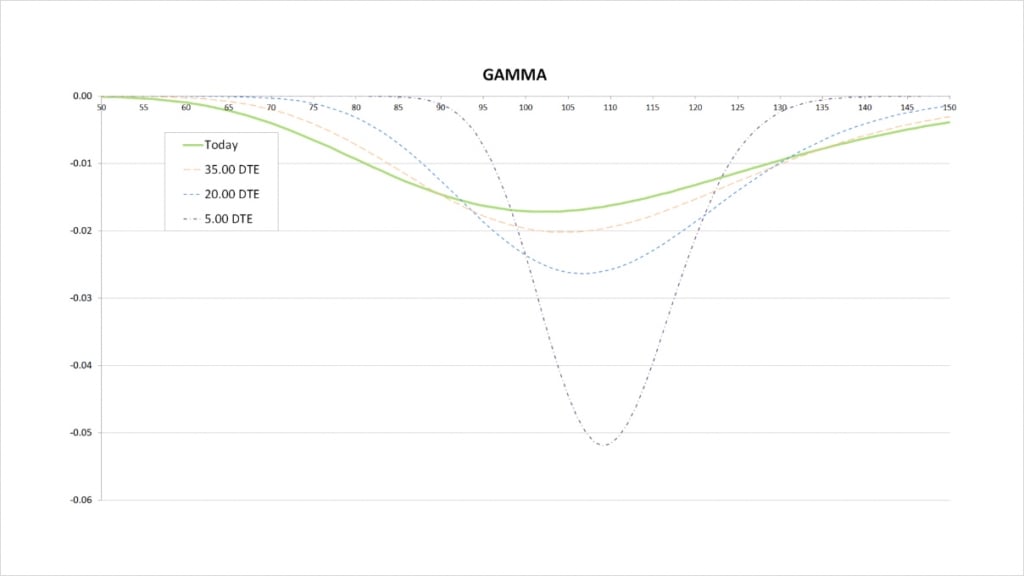
For the current values of delta with 50 days remaining until expiry, we see that delta decreases slowly at first while the call is far OTM, with the decrease then picking up speed as the call is close to the money, and finally the decrease slowing again as the call is deep ITM. On the gamma chart this results in gamma starting very small, peaking in magnitude when the call gets closer to the money, and then reducing in magnitude again as the call gets deep ITM.
As we get much closer to expiry, the price range where there is any significant change in delta due to price movements is much narrower, but delta changes much quicker within this range. On the gamma chart this results in a narrower price range for significant gamma, and a peak that is larger in magnitude. The less time until the call expires, the closer the peak in gamma will be to the strike price of the call.
It’s worth noting that this gamma chart would be exactly the same whether we had the position in the underlying or not. The delta of the position in the underlying does not change and therefore has no gamma, so we are essentially just looking at the gamma chart of being short the $110 call.
Vega
This is also true for vega. Changes in implied volatility have no impact on the value of the position in the underlying, therefore when we look at the vega for the covered call, we are in fact just looking at the vega of being short the call option.
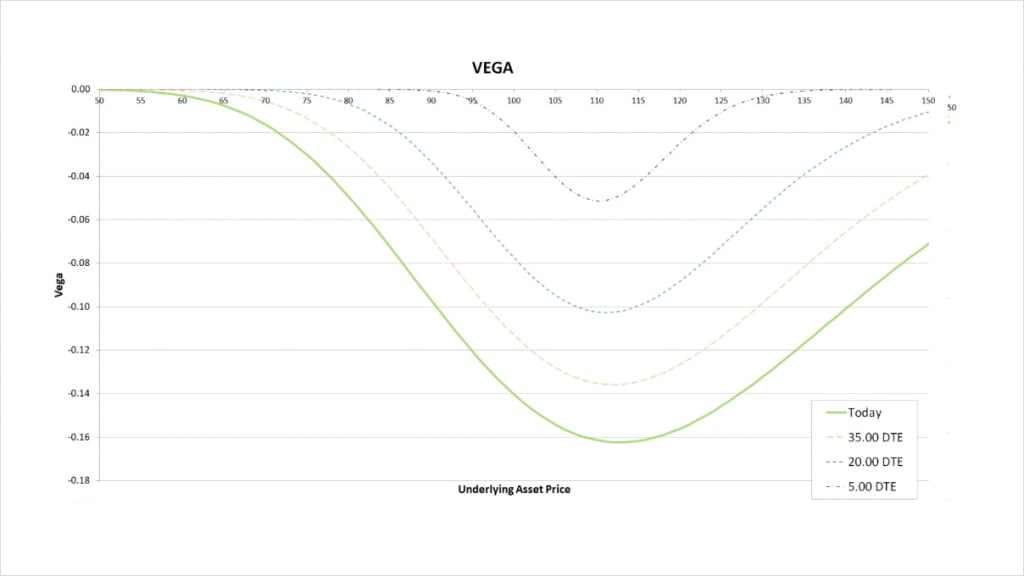
As you may remember from section 10, where we studied vega in more detail, the seller of a call option has a negative vega. The magnitude of this vega is greatest when the option is close to the money, and as time passes, the magnitude decreases no matter where the underlying price is in relation to the strike price.
Theta
Time passing does not have an impact on the value of position in the underlying, therefore when we look at the theta for the covered call, we are also just looking at the theta of being short the call option.
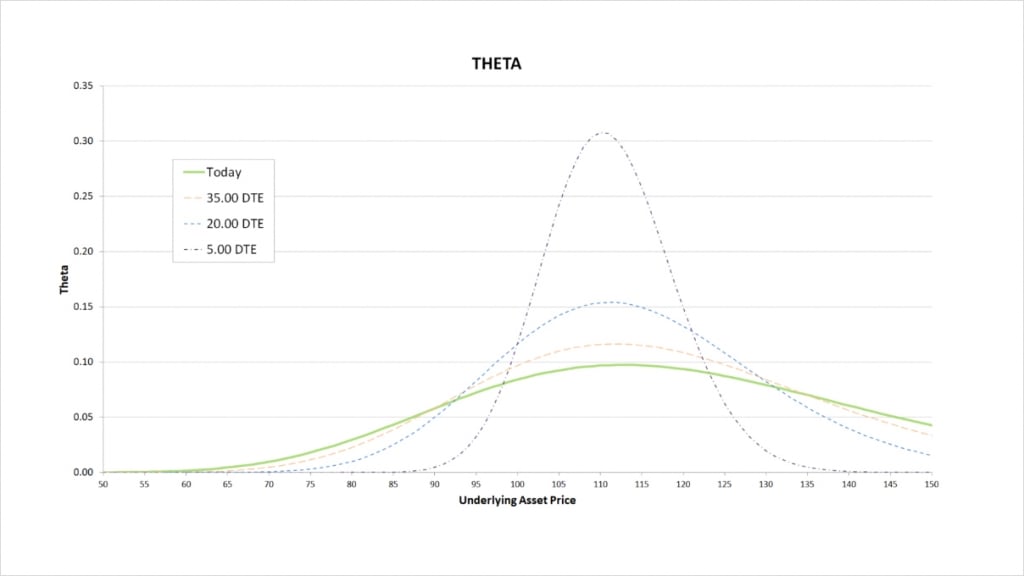
Options do lose value as time passes, but as the seller of a call option here, the loss in value of the call represents a gain for us, hence the positive theta.
Theta is greatest when the call is close to the money. This is where the call will have the most extrinsic value, and therefore the most value to lose to time decay.
What happens to the theta as time passes depends on where the underlying price is relative to the strike price of $110. When the underlying price is close to the strike price, theta increases as time passes. That is, the call loses value at an ever accelerating rate as time passes. When the call is either deep ITM or deep OTM, the theta decreases as time passes. That is, the call loses its value more slowly as time passes.
Inverse option contracts
A covered call consists of a long position in the underlying combined with a short call option with the same position size. The same is true when using the inverse option contracts on Deribit. The difference arises when we realise that our account balance on Deribit for trading the inverse contracts is already stored in the underlying asset, so we don’t need to execute a buy/long, we only need to sell a call option with a position size equal to our account balance. (assuming we want to use the whole account for our covered call trade).
For example, let’s say we want to execute a covered call on bitcoin, and we already have 1 BTC in our Deribit account. We are already holding the underlying asset of bitcoin, so we simply need to sell 1 call option to turn it into a covered call.
Bear in mind that with this basic example that will be common to traders who already have funds on Deribit, we are already long the underlying simply by holding it. We are not starting from a position of being in dollars. If instead we are starting from a position of being in dollars (or your local fiat currency), to execute the same covered call we would first need to purchase 1 BTC with our dollars and place it in our Deribit trading account, then sell the call as before.
As always with the inverse contracts, it’s possible to execute any position you may already be familiar with from more traditional markets and linear contracts. All that is needed is to remain aware of your starting position, and the position you are trying to get to. The required adjustment is normally limited to the simple inclusion or exclusion of a single leg.
In this case of a covered call, if we are already holding the underlying because we have added some bitcoin into our Deribit account, we don’t need to go to the trouble of executing the long underlying leg of the covered call, because it already exists.
A covered call at expiry
The vertical spreads we covered in the previous 4 lectures consisted solely of options. These options all shared the same expiry date, so there was nothing to manage after expiration. This is not the case with a covered call though.
When the option expires, it’s worth remembering that unless the long position in the underlying was created using futures contracts that share the same expiry date as the call option, we will still be left with the long position in the underlying. At that point we may wish to sell the underlying back into cash, sell another call to turn it into a new covered call strategy, or simply remain long the underlying. It’s up to each trader to decide the best course of action, but it’s important to always be aware of which parts of a portfolio are going to expire when, and therefore any additional adjustments that may be necessary to remain positioned as desired.
Selling covered calls for yield
It is common to see covered calls mentioned in the context of generating yield on your holdings. For example, you may be holding some bitcoin already, and wish to generate some form of income from it.
In fact, there is a growing market for DOVs (Defi Option Vaults) that automate the process of executing covered calls (among other option strategies). These can be useful for a more passive approach. However, do bear in mind that these DOVs typically run continuously, meaning that while they require minimal effort to invest in, they will sell volatility no matter what, even when a trader may not judge that to be a wise choice. Someone is also taking their cut in the middle, so if you have direct access to the underlying option markets (and the time and desire to be more active), you may get better prices by executing it yourself.
Whether executing covered calls manually or in a more automated way such as a DOV, it is wise to be aware of where the “yield” is coming from. You are collecting a premium for selling the call, but this is in exchange for the risk of having your assets called away and not benefitting from further price increases. For this reason it’s wise to be cautious when comparing the yield from the short call to other forms of yield that are available. Always bear in mind where the yield is actually coming from, and what risk you are being compensated for.