

So far everything we’ve covered has been theory based, and indeed there is plenty more of that to come. Towards the end of the course we will work through many live trades, but it’s now time to put some of the theory that’s already been covered into practice with our first live trade example.
In this first example we’re going to buy a call option live on Tastyworks. We will look at what our potential profit will be at expiration, taking into account the premium we pay and the strike price, and we will then let the option expire. Once the option has expired we will analyse how the position performed and calculate how much profit/loss was made.
The instrument we’re going to trade today is SLV, which is a silver ETF. It tracks the spot price of silver quite closely, and typically has good liquidity, so it is used by traders wanting exposure to the price of silver. As it’s a relatively low share price, even with a contract multiplier of 100, it’s still very accessible for traders of all sizes, as you’ll see.
First let’s take a quick look at the current price of SLV on a chart I’ve pulled from Trading View.
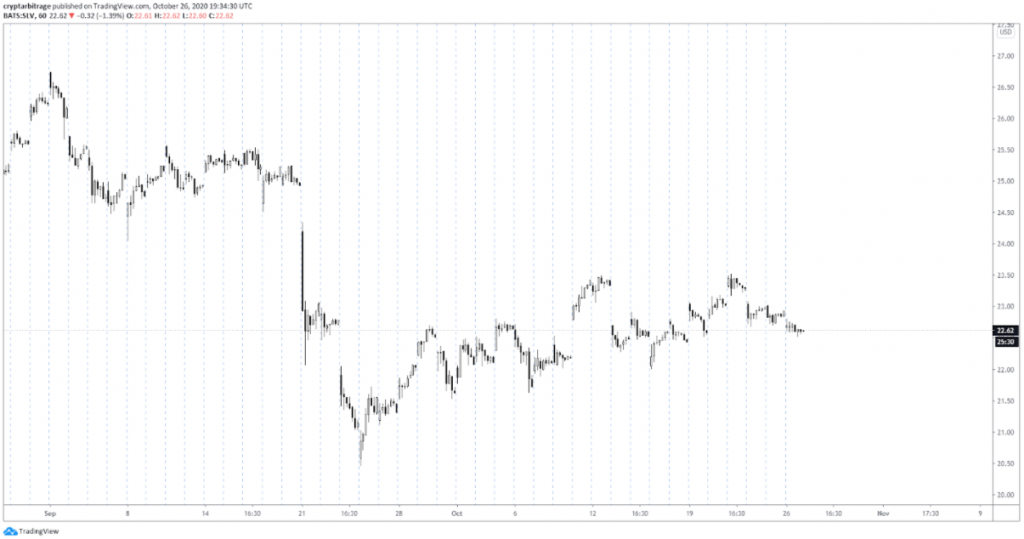
This is a one hour chart of the price of SLV, meaning each candle represents one hour. The vertical dotted lines denote different sessions, i.e. the different days. Because SLV only trades for a certain number of hours on weekdays, it is not uncommon to see the price gap up or down when a new session begins. You can see examples of that in the gaps in price between bars.
It’s currently Monday the 26th October, with SLV trading at around $22.62. Let’s say we have a view that the price of SLV is going to increase this week and break through the highs at about $23.50 set over the last 2 weeks. To make sure we profit if this happens, we want to buy a call option. We’re going to buy the call option that expires on Friday (which is October 30th), with a strike price of $23.50. Let’s head over to the tastyworks software to check out the prices and place the trade.
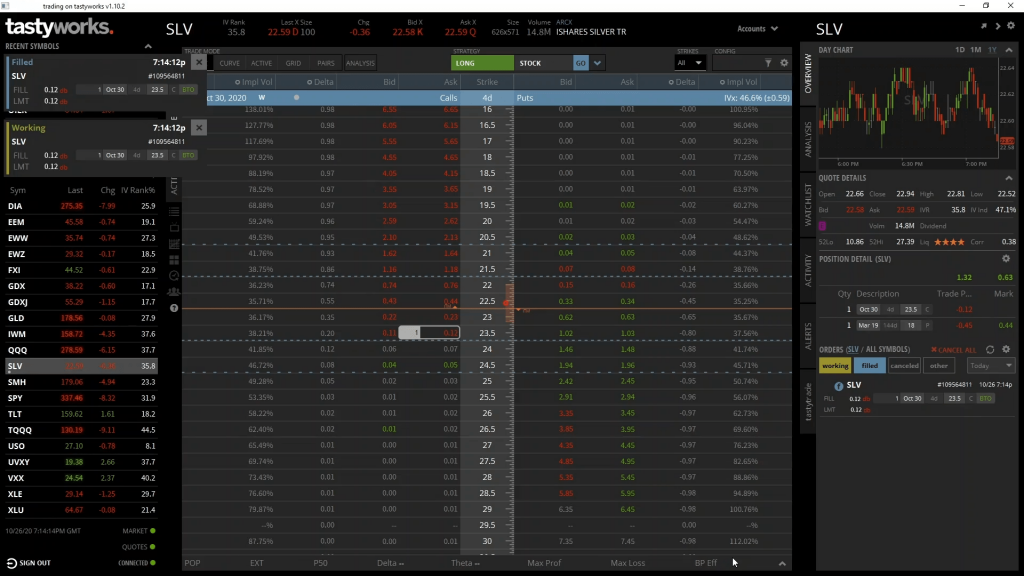
Here we have the option chain for SLV. As you can see in the top left here, I’ve expanded the October 30th expiry date, so every option on the screen here expires on Friday.
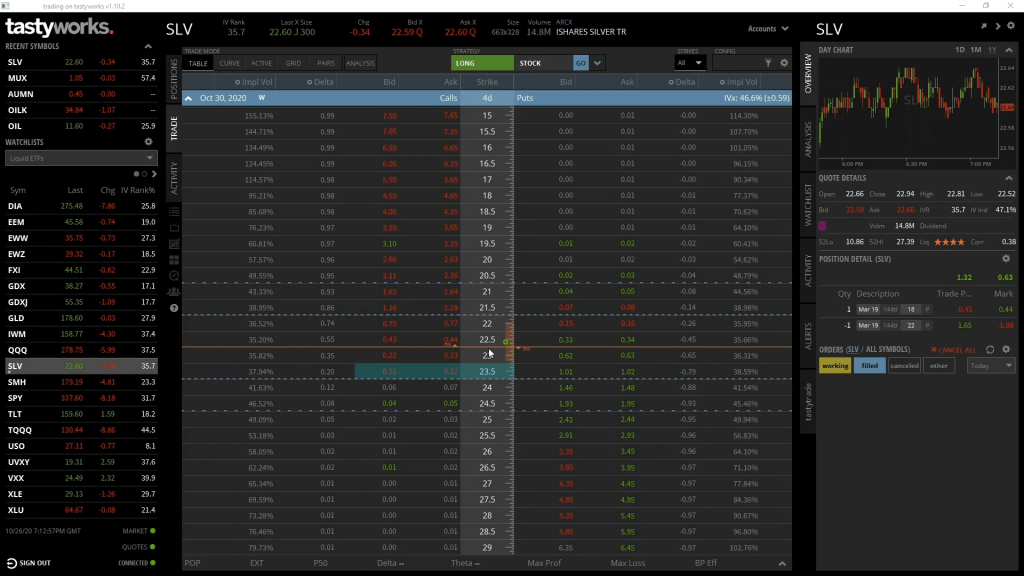
As usual, we have strike prices down the middle, with calls on the left, and puts on the right. We’re interested in the $23.50 strike price, which we can find in the middle column. And we want the call, so we head left from here.
There are two different price columns here, the bid column, and the ask column. Briefly, the bid is what we could currently sell this option for immediately, which is 11 cents in this case. The ask is what we could currently buy this option for immediately, which is 12 cents in this case. For today’s example, to ensure a timely fill for our order we will just take the price that is on offer, but we’ll cover in some future examples how to leave orders at different prices.
On tastyworks the order form is underneath the option chain. To populate this form with an order to buy the call, we can click on the ask price of 12 cents. This is where we can enter and adjust our orders before we send them.
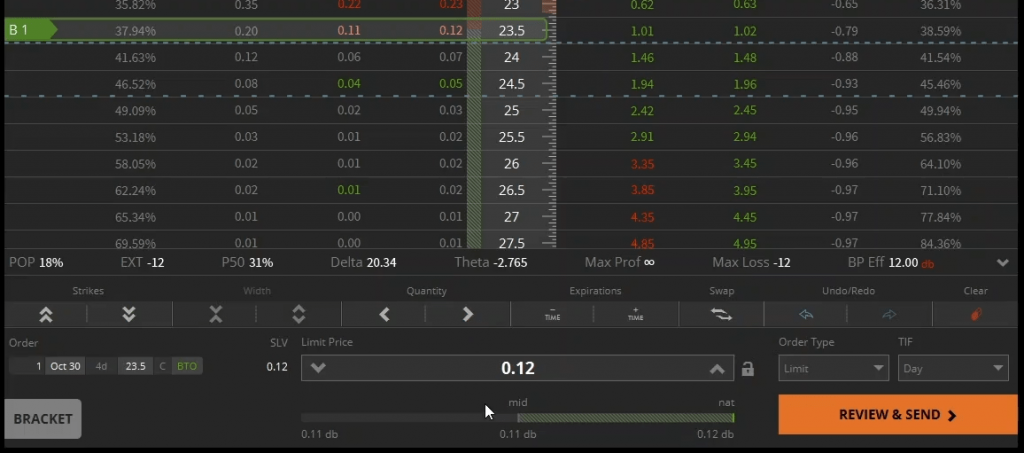
As you can see, by clicking the ask price for this option, it’s populated the form with the call option details on the left. With the 1 representing the number of contracts, Oct 30 being the expiry date, 4d being the number of days until the option expires, 23.5 being the strike price, C denoting a call, and BTO in green denoting that it’s a buy order.
Next, the limit price for the order is the ask price of 12 cents that we just clicked on. To the right there are some options to change the order type, but as we know this order will fill immediately, we don’t need to adjust those.
I’ll click REVIEW & SEND in the bottom right, which will bring up the confirmation screen. This will display all the details of the order we just entered, including any additional trading fees that we will need to pay.
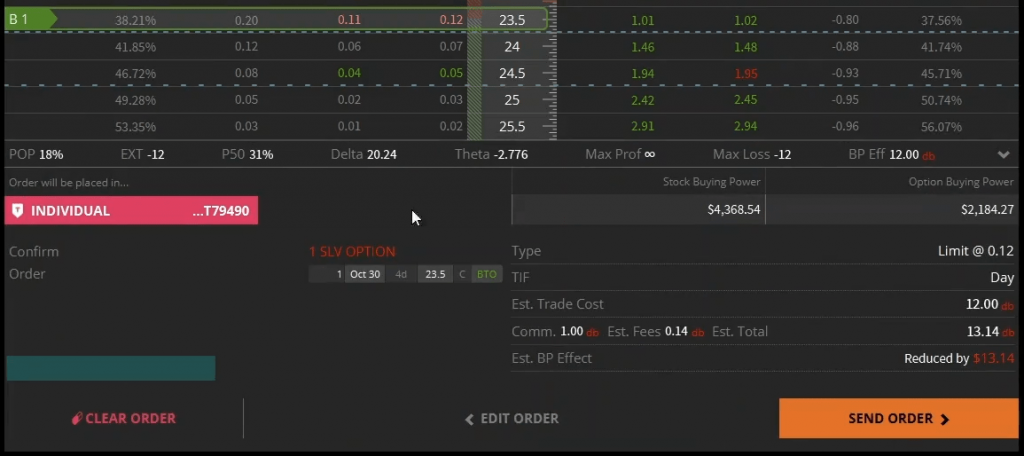
Once we click SEND ORDER, the order will be sent into the market. Because we are buying straight into the current ask price of 12 cents, this order filled immediately. The pop ups show first that the order was working in the market, and then immediately that it was filled. We can also see on the right hand side of the screen that the order has indeed been filled for a debit of 12 cents.
This option will expire in 4 days, but first let’s look at what could happen with this position depending on what happens to the price of SLV in the next four days. We can use what we’ve learned so far in section 3 to calculate our potential profit, potential loss, and where the breakeven point on this trade is. Then once we’ve looked at what could possibly happen, we can skip ahead and compare that to what actually happened.
What could happen
Let’s remind ourselves of the option parameters we have for this position:
- The underlying asset is shares of SLV
- The option type is call
- The expiry date is 30th October 2020
- The strike price is $23.50
- The option price (or premium) is $0.12 per share
In the theoretical examples we’ve covered so far, we have ignored fees to make sure the topic being covered is conveyed as simply and clearly as possible. As this is a real world example though we will include the fees in our calculations.
The total fees and commission for our order were $1.14. As the contract multiplier for SLV is 100, each option contract represents 100 shares of SLV. We purchased 1 contract, representing 100 shares, so this total fee of $1.14 equates to a fee per share of $0.0114, or a little over 1 cent. Knowing the per share amount will come in handy with some of our calculations, because we can simply add this to the premium per share to give us the total cost per share.
PNL chart
Given all the parameters we just covered, this is the PNL chart at expiry for this option position.
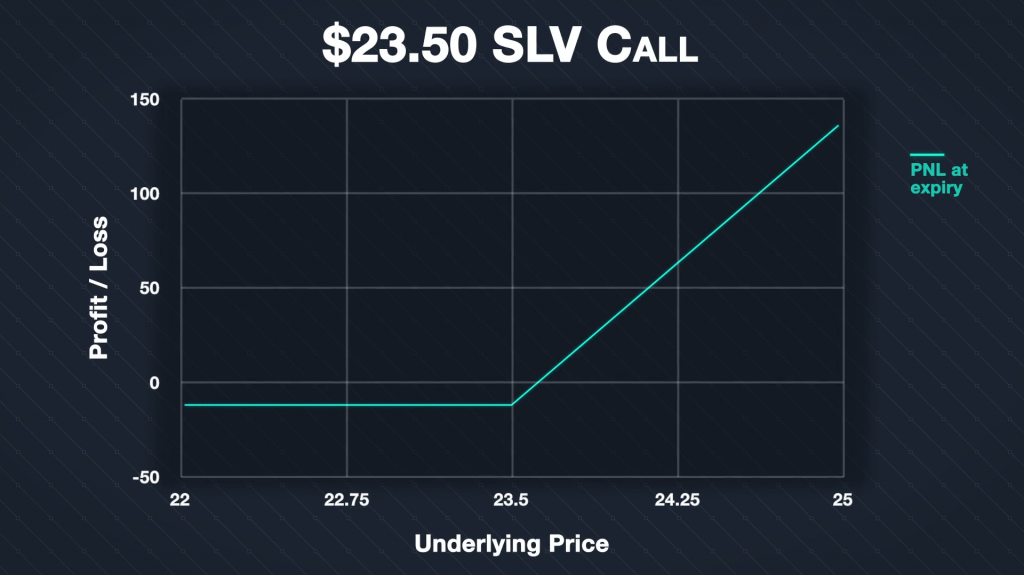
For any price of SLV below the strike price of $23.50, we will make the maximum possible loss. This maximum loss is limited to the premium we paid, plus the fees. We paid a premium of $0.12 per share, and the fees were $0.0114 per share. This gives us a total cost per share of $0.1314. As the contract multiplier is 100 and we purchased 1 contract, this equates to a total maximum loss of $13.14. And indeed this amount is what was shown as the total cost when we placed the order on Tastyworks.
If SLV is any price above our strike price of $23.50 at expiry, we can calculate our profit or loss using the formula from lecture 3.3:
(Price At Expiration – Strike Price – Premium Paid) * Contract Multiplier * Number Of Contracts
Except instead of just using the premium paid per share, we can use the total cost per share, which includes the fees. So $0.1314 per share.
The profit/loss line increasing to the right of our strike price is just this same formula plotted for each underlying price of SLV at expiry.
As an example, if the price of SLV at expiration is $24.75, we can calculate our profit as:
(24.75 – 23.50 – 0.1314) * 100 * 1 = $111.86
If the price of SLV at expiration is $24.75, our option to purchase SLV at $23.50 is clearly worth $1.25 per share, for a total of $125. As this option cost us $13.14 in total, this gives us our profit of $111.86.
Breakeven
In lecture 3.4, we gave the formula for the breakeven point of a call option as:
Breakeven Point = Strike Price + Premium Paid
As with the profit calculations, instead of using just the premium paid, we will use the total cost including fees, which is $0.1314 per share. The breakeven point is then calculated as:
$23.50 + $0.1314 = $23.6314
This is the point at which the profit/loss line crosses the x axis.
What actually happened
Now we’ve had a quick look at what could happen, let’s jump forward and find out what actually did happen. Here we have the same 1 hour price chart of SLV we looked at just before placing the trade. Except now of course, it’s the end of Friday 30th October, so our option has expired.
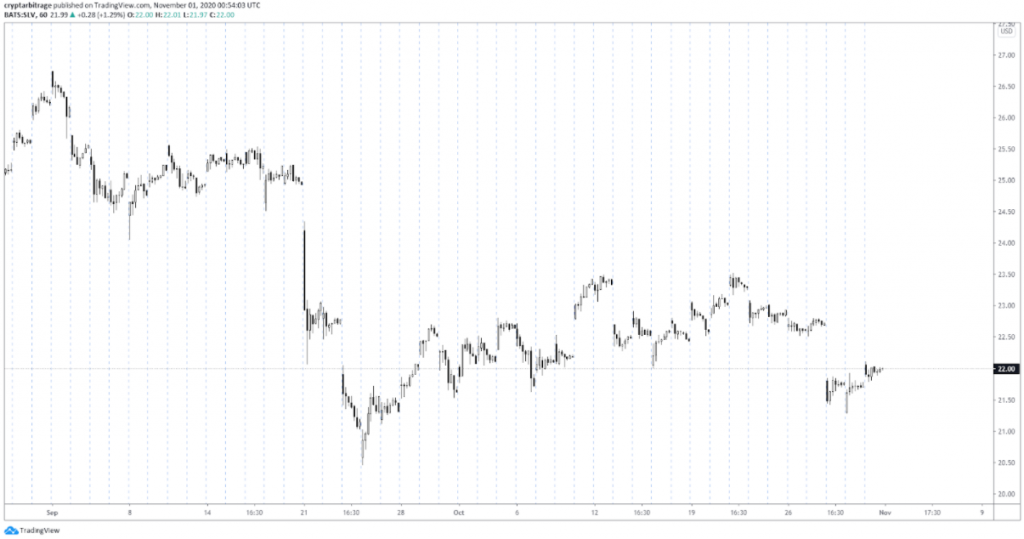
We can see the point in time we bought the call option on the 26th. After moving up very slightly on the 27th, price gapped down hard at the start of the next session, then recovered slightly over the remaining two days. When the option expired, the price of SLV was still just $22. This is below our strike price of $23.50, so the option has expired worthless, resulting in the maximum possible loss for this trade of $13.14.
Underlying position comparison
We began with a bullish bias, and bought the call option. This resulted in a loss, but how does this loss compare to a position in the underlying? In other words, what if we had just purchased 100 shares of SLV instead?
You may remember the price of SLV was $22.62 when we purchased the call, so we could have purchased 100 shares for $2,262 instead. At the end of Friday the price had decreased to $22 exactly, meaning our 100 shares would only be worth $2,200. This means purchasing the shares themselves would have resulted in a loss of $62, considerably more than the $13.14 we lost by purchasing the call instead.
It’s also worth noting that even if we used 2x leverage, purchasing the 100 shares would have required over one thousand dollars of capital, whereas the call option only required $13.14 in total. So not only did the call option lose less money than buying the shares directly, but it also required over 80 times less capital to execute.