


The Black Scholes Merton formulas are freely available online in many places. I don’t think there’s much value I can add about the mathematical formulas themselves to what you’ll learn about them by simply reading the definitions on sites such as Investopedia or Wikipedia. So instead of going through all the formulas in detail and how they are derived, we will simply state the main formula for calculating the value of a call option and then pull out an interesting use for one part of the formula.
The formula
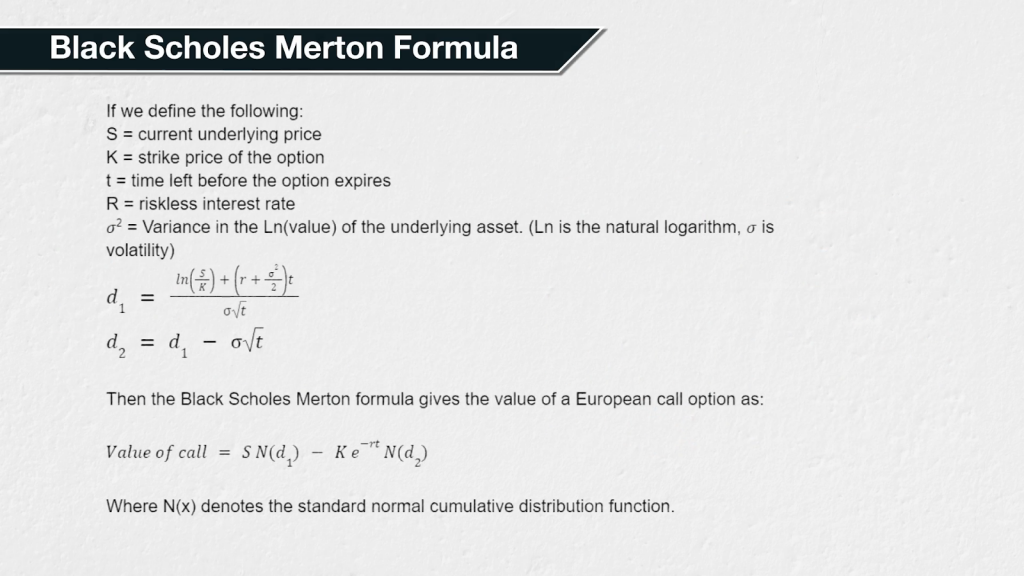
If we define the following:
S = current underlying price
K = strike price of the option
t = time left before the option expires
R = riskless interest rate
𝜎2 = Variance in the Ln(value) of the underlying asset. (Ln is the natural logarithm, 𝜎 is volatility)
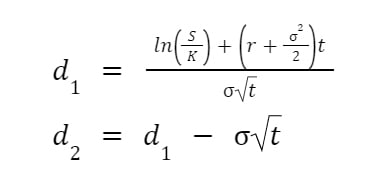
Then the Black Scholes Merton formula gives the value of a European call option as:
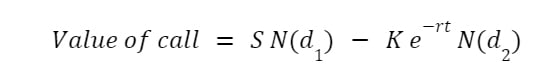
Where N(x) denotes the standard normal cumulative distribution function.
As I said we’re not going to spend time analysing how this is derived. It’s beyond the scope of this course, and it’s not necessary for a basic understanding of options. However, what we are going to look at in a little more detail is the last term of the formula N(d2).
Implied probability of expiring in the money
Given all the assumptions of the model, N(d2) equates to the implied probability of the option being exercised. In other words the implied probability that the option will be in the money and worth something at expiry.
Using current option prices, or more specifically their implied volatilities, we can create a chart of these implied probabilities. The chart we plot tells us how the options market is currently pricing the probability of the underlying price being above each strike price on the expiry date of the options.
This is an example of the type of chart that is possible, that I created in August 2020.
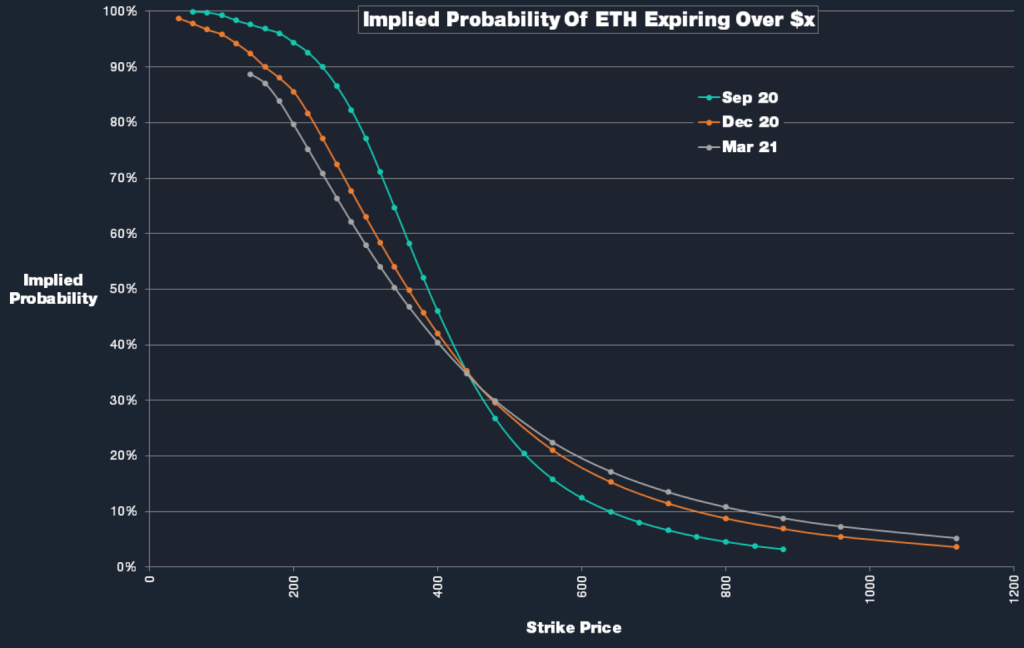
This chart is using the option prices for Ethereum from three different expiry dates. September 2020 in teal, December 2020 in orange, and March 2021 in grey. Ethereum was around $400 at the time.
Let’s use the $650 strike as an example. Here we can see in the September expiry, the $650 strike option is currently implying about a 10% chance of the underlying price being over $650 when the September options expire. For December, the implied probability of the underlying price being over $650 is about 15%. For the March 2021 expiry the implied probability of the underlying price being over $650 is about 17%.
If you think about your own view on the market in a probabilistic manner, you can compare your view to that of current option prices using these values for N(d2). If you manage to find a large imbalance somewhere between your view and the market’s view, you may have found an opportunity to make a nice profit if your view turns out to be correct.
For example if you thought here that there was more like a 20% chance that Ethereum will be above $650 by the September expiry, then the September calls may be offering you some great value buys at the moment.
We only gave the Black Scholes formula for the call option above. There is one for puts as well of course, though it is derived from the formula for calls and using something called put call parity. There are some other useful data points that can be derived from the Black Scholes model. Speaking of which, it’s finally time to start looking at the Greeks. In the next lecture we will give an introduction to the Greeks. We will then take a more detailed look at each Greek in separate sections.