


When looking at volatility smiles and skew in the previous lectures, we have been looking at the differing volatility figures for each strike price, but only for options with the same expiration date. Implied volatility will also usually vary across each available expiry, giving us something called the volatility term structure. You may be familiar with the phrase ‘term structure’ if you trade futures, where it is used to describe the difference in futures premiums across the available futures contract expiries.
This is an example of a term structure for the bitcoin futures contracts on Deribit.
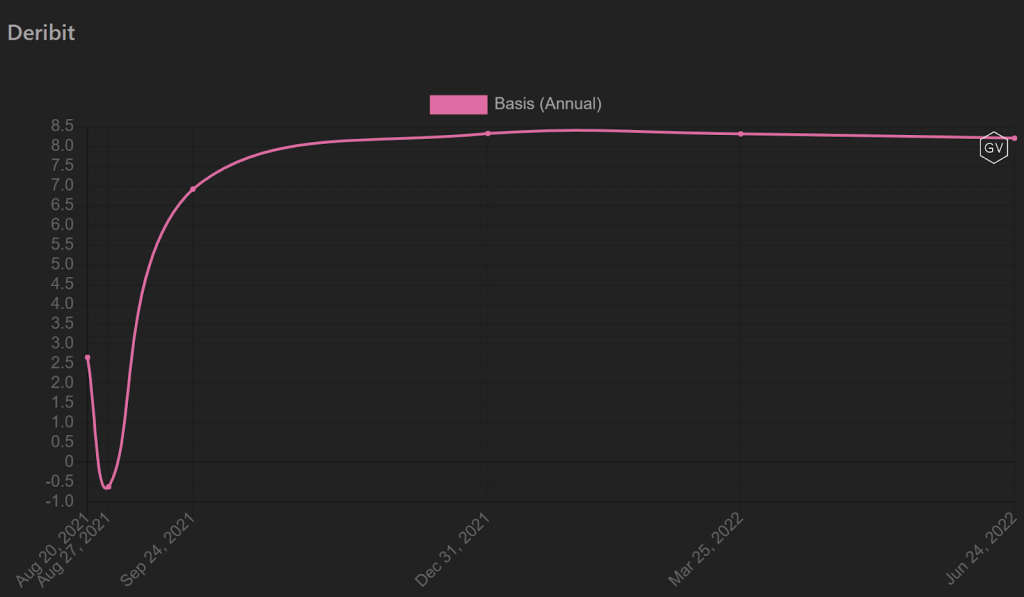
What this chart is showing is the premium of each of the different future expirations over the spot price. Rather than the dollar amount, this is showing the premiums as an annualised percentage, to allow for better comparison.
With the exception of the two near dated expiries, the term structure here is very flat. The percentage is very similar for the next four quarterlies. The near dated expiries can fluctuate quite a bit. Due to the low number of days until expiry, even a small change in the dollar premium can translate into a relatively large change in the annualised percentage.
The 20th of August future is currently at about 2.5% annualised premium. The 27th August future is actually currently at roughly a 0.5% discount, meaning the future is trading at a price lower than the spot price. Once we get out to the September quarterly though, the premium is up at 7% annualised, and each of the other three quarterlies are between 8 and 8.5%.
These percentages are not fixed, and can vary wildly over time. The same is true for the volatility term structure for options, which also fluctuates.
This is the current implied volatility term structure for the bitcoin options on Deribit.
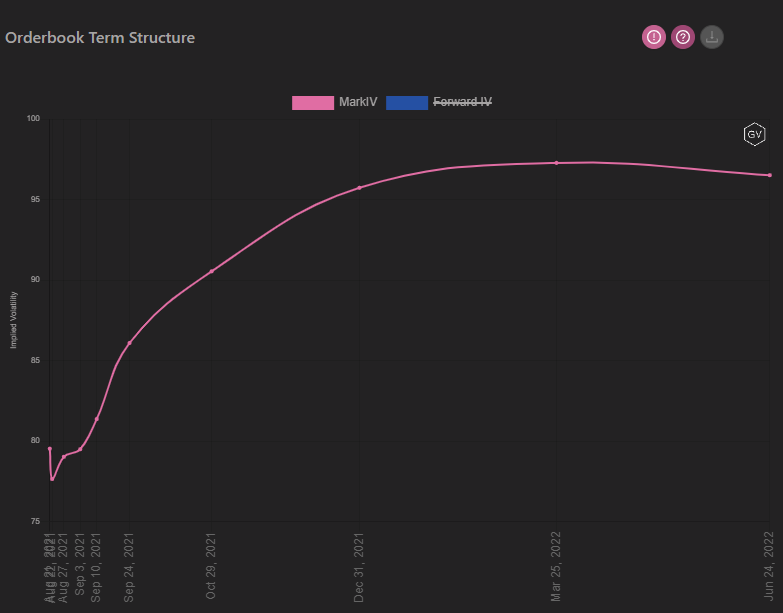
The nearest dates have IV of a little under 80%. This then increases slowly the further out in time we move, until eventually topping out at about 97%.
As we’ve covered previously, the implied volatilities will vary even within the same expiry, so it’s important to understand which value is being used for the term structure. It is the IV of the ATM strikes that are used to show the term structure. This gives a good comparison of how the volatility varies between each expiry, but does not give any indication of the skew within each expiry.
Volatility surface
While the term structure can be useful by itself, for those wishing to have a more detailed view, it is possible to see a combination of the term structure and the skews for each expiry. To see both at once we need to generate a volatility surface. A volatility surface combines the volatility skews with the term structure, showing the implied volatilities of multiple options from multiple expiries on a three dimensional surface.
This is an example of a volatility surface on Genesis Volatility. It’s showing the current vol surface for bitcoin options.
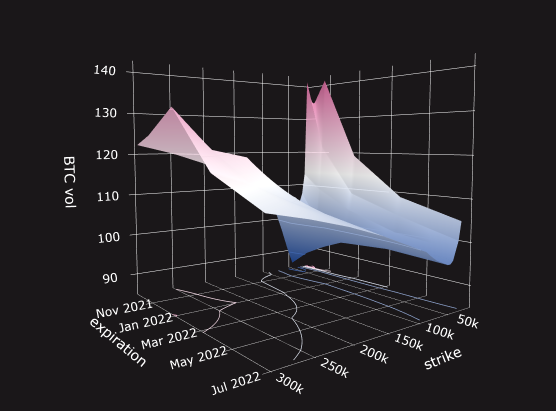
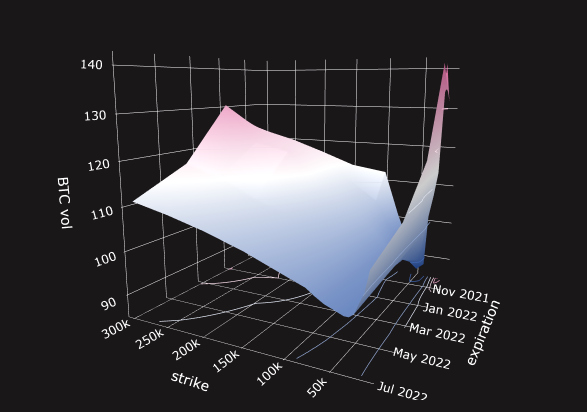
The three axes are:
-Strike price
-Expiration date
-Implied Volatility
The lower volatilities here are highlighted in blue, with the highest volatilities in red. Both of these extremes in this example are with the short dated OTM options.
Spreadsheet volatility surface
If you prefer, it’s also possible to draw a volatility surface in a spreadsheet. This is one I’ve drawn up quickly in excel using some artificial example data.
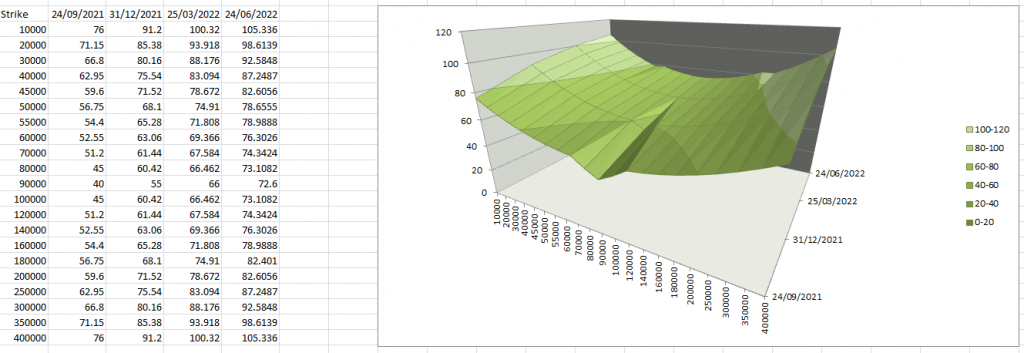
If you wanted to hook this up to live data you could use Cryptosheets.com to pull in the live figures from Deribit. Cryptosheets is useful for building any spreadsheet that requires data to be pulled in using an exchange’s api, and thankfully doesn’t require you to have any knowledge of the api’s yourself.
Summary
As well as varying per strike across a given expiry, implied volatility will also differ between each of the available expiries as well. Plotting these different figures for the ATM options gives us the volatility term structure. This allows us to see the market’s view of future volatility by date.
If we combine this with the data for the other options in each expiry as well, we get a volatility surface. This gives us a more detailed, and of course more complicated, view of implied volatility.
It is possible to create both term structures and volatility surfaces in spreadsheets, though there are useful tools available to do this work for you.