Theta is a measure of how much value an option is expected to lose as time passes. The total amount of time left until expiration (DTE = days to expiry) will itself have an effect on the rate at which an option’s value will decay.
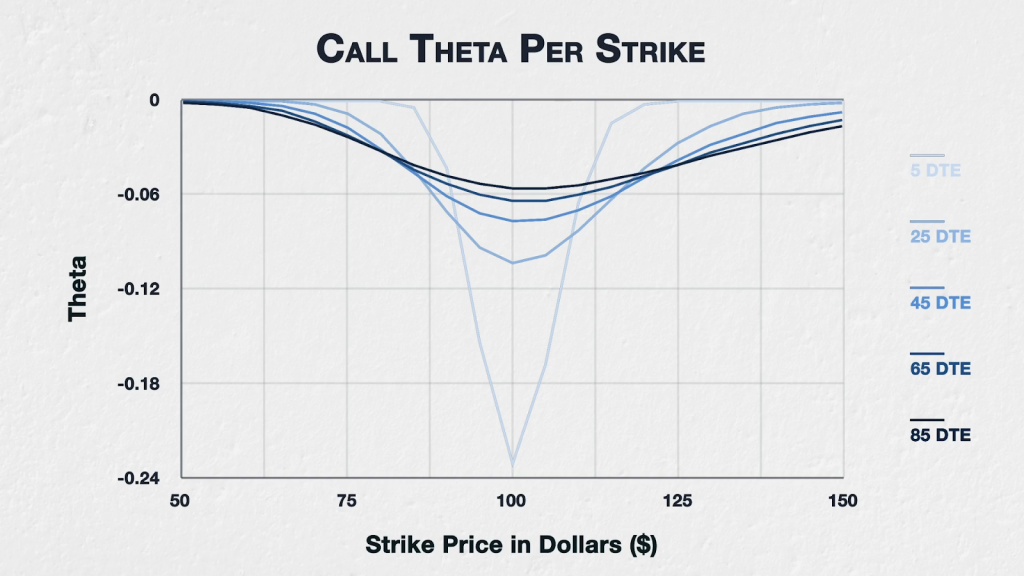
This chart shows the theta for all options of a fictional asset with a current price of $100, implied volatility of 50%, and varying DTE. The strikes range from $50 to $150, and the DTE ranges from 5 up to 85.

We can see here that time has a different effect on an option’s theta depending on where the option’s strike price is relative to the underlying price.
For options that are either deep ITM or deep OTM, as time passes and the DTE decreases, theta decreases. How far away from the current price they need to be to see this effect can vary depending on both time and volatility. In this example this is true for the strikes $75 and below, and for strikes $130 and above.
The reason for this behaviour is the deep ITM and deep OTM option have so little extrinsic value left as DTE decreases, that there is increasingly little value remaining to be decayed away by theta. In other words, the rate that these options are losing their extrinsic value is outpacing the reduction in DTE. So despite the reduction in DTE as well, theta is getting smaller as time passes.
To help illustrate this concept, let’s use a simplified example. Imagine an option has a value of $10, and 10 days left to expiry. While it’s not going to be exactly equal to theta decay, we could say that this option is going to lose an average of $1 a day for the next 10 days. We can think of this $1/day figure as a simplified average version of theta.
Now imagine that 5 days pass, but that the option loses $6 in value during that time. The option now has a value of $4, and 5 days left to expiry. We could now say this option is going to lose an average of $0.80 a day for the next 5 days ($4 / 5). So our simplified average version of theta has now reduced from $1 to $0.80.
ATM options
For ATM options the picture is very different. For options that are ATM, or close to it, as time passes and the DTE decreases, theta increases. In this example we can see this effect for the options with strikes between $95 and $105 inclusive.
The reason for this behaviour, is that unlike the deep ITM and deep OTM options, for the ATM options, the rate that these options are losing their extrinsic value is not outpacing the reduction in DTE. So time is decaying faster than their extrinsic value.
To use a similar simplified example, imagine again that an option has a value of $10, and 10 days left to expiry. We could say that this option is going to lose an average of $1 a day for the next 10 days, so we can think of this $1/day figure as a simplified average version of theta.
Now imagine that 5 days pass, but that the option only loses $4 in value during that time. The option now has a value of $6, and 5 days left to expiry. We could now say this option is going to lose an average of $1.20 a day for the next 5 days ($6 / 5). So our simplified average version of theta has now increased from $1 to $1.20.
This time, 50% of the time has passed, but only 40% of the option’s value was lost. As a result, our simplified version of theta has increased. This is essentially what’s happening for the theta of the ATM options in our more detailed example as well, again just with slightly more complicated maths behind it.
Individual option views
Let’s now look at 5 of the call options to further illustrate how their theta evolves, and how their extrinsic value decays.
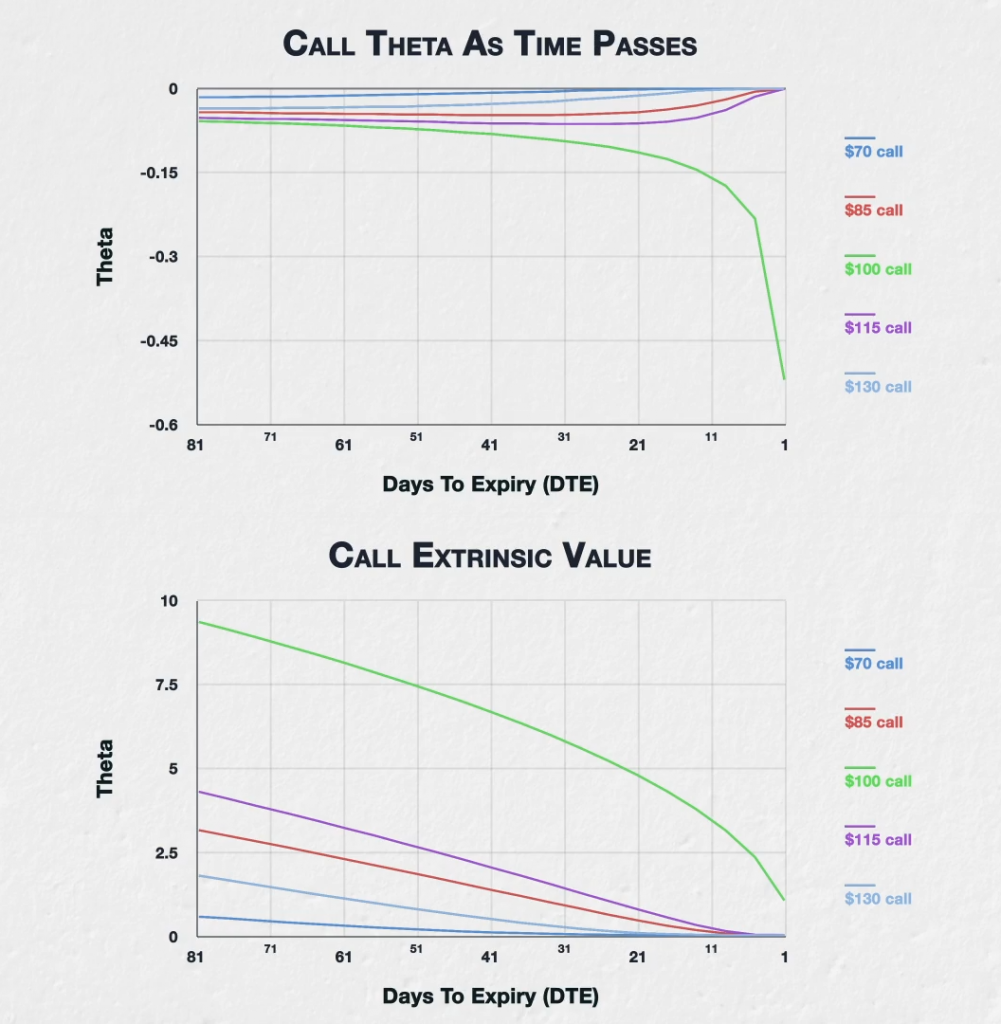
This chart shows the theta of the $70, $85, $100, $115, and $130 call options. The x axis now shows the days to expiry, so as we move from left to right on the chart, we can see how the theta changes for each of these options as time passes.

Let’s pair this theta chart with this chart that displays the extrinsic value for these options over the same time period. In this chart we see the extrinsic value remaining in each option. As we move from left to right we see the extrinsic value reducing as time passes.
Note that this isn’t showing the total value of each option, only the extrinsic value that decays away as time passes. This allows us to see only the part of their value that is affected by theta.
These two charts are another way of visualising the behaviour of the decay of these options that we have talked about already, but with more detail on a smaller number of options.
For the $70 call (which is deep ITM) and the $130 call (which is deep OTM), the theta reduces at a relatively steady rate. And when I say reduce here, I mean it gets closer to zero. They don’t have a lot of extrinsic value to begin with, and any they do have is mostly gone long before expiration. On the extrinsic value chart we can see this behaviour by noticing the steepness of the reduction in their extrinsic value. At first their extrinsic value reduces relatively quickly, slowing down before expiration with the lines getting flatter.
For the $85 call (which is ITM) and the $115 call (which is OTM), the theta behaves in a similar way, but reducing at a slower rate at first, then the theta reduces much faster as we get closer to expiration. On the extrinsic value chart, this translates to a very steady decline in extrinsic value right up until about 15 DTE, when the decline slows and the lines flatten off into expiry.
Finally, moving onto the ATM $100 call, this behaves very differently. Instead of getting smaller, the effect of theta increases over time; steadily at first, then much more rapidly as we come into expiry. This means the extrinsic value of the ATM option is lost at an ever increasing rate, getting much faster as we come into expiry, with the line getting ever steeper.
In summary
The more time left until an option expires, the more time is left for the extrinsic value of the option to decay. The time left until the option expires (DTE) will have an effect on option thetas, and this effect will vary depending on where the strike price is in relation to the underlying price.
Higher DTE will result in higher theta for both deep ITM and deep OTM options.
Higher DTE will also result in lower theta for ATM options.
Lower DTE will result in lower theta for both deep ITM and deep OTM options.
Lower DTE will also result in higher theta for ATM options.


